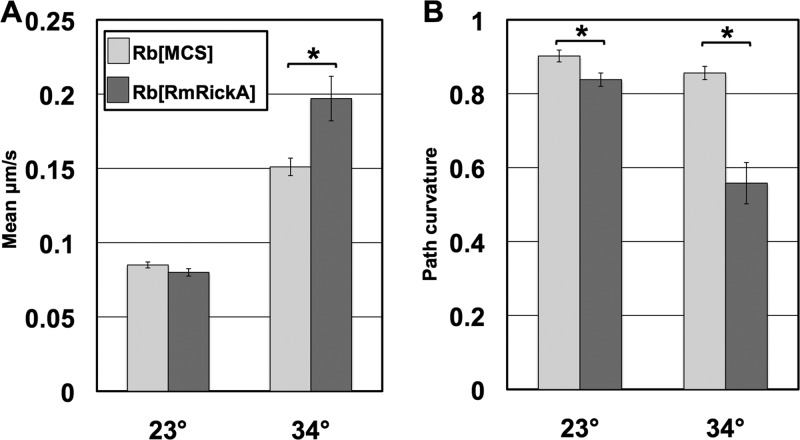
FIG 5.
Comparison of mean velocity and mean path curvature values of the rickettsial transformants. Asterisks indicate significant differences between transformants for the same temperature and phenotype observed. (A) Comparisons of mean velocities of R. bellii transformants. Results showed a substantial increase in the mean velocity of both groups at 34°C. (B) Mean path curvature values of transformants. As a path curvature value approaches 1, the straighter the path the bacteria have followed. At 23°C, the mean path of R. belliiRmRickA was marginally, though significantly, more curved than that of R. belliiMCS. At 34°C, however, the path curvature value was much lower in R. belliiRmRickA, corresponding to more curved and convoluted paths. The exacerbation of phenotypic differences at 34°C relative to 23°C indicates the temperature dependence of the response. Error bars show standard errors.

