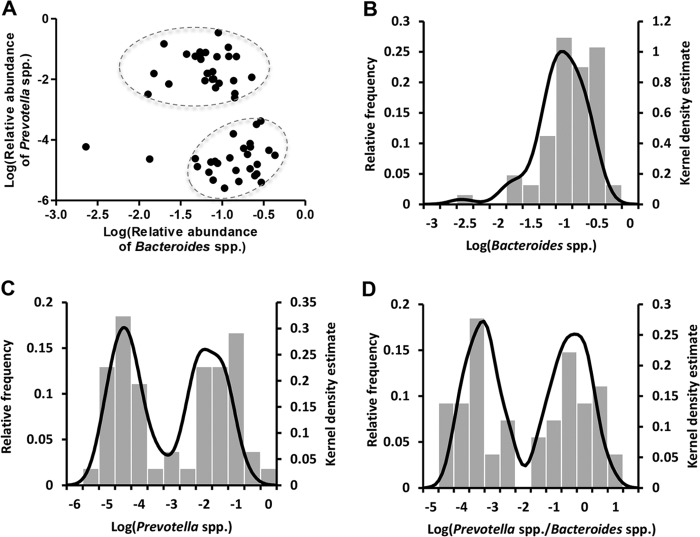
FIG 1.
Inferred Prevotella/Bacteroides groups. (A) The log-normalized abundances of Bacteroides spp. versus the log-normalized abundances of Prevotella spp. for all subjects before the intervention. Subjects fall into two groups, indicated with two circles. Kernel density plots of log-normalized relative abundance of Bacteroides spp. (B), Prevotella spp. (C), and Prevotella-to-Bacteroides ratio (D) for all subjects. Subjects (n = 8) with no measured Prevotella spp. at any time point were excluded in this figure.

