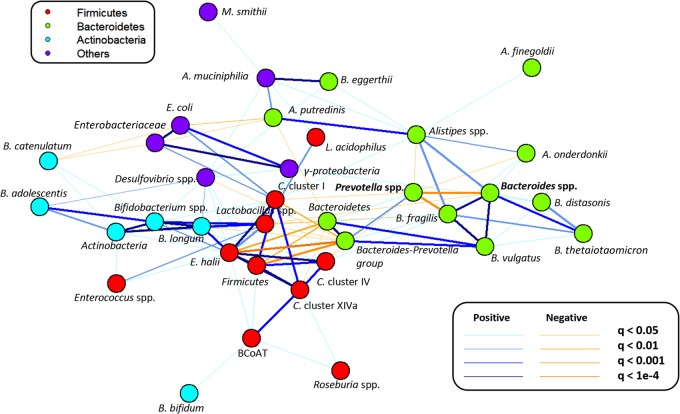
FIG 2.
Cooccurrence network of 35 quantified bacterial taxa. The different colors refer to the different bacterial phyla, and nodes represent bacterial taxa. Positively correlated taxa are marked with blue lines, and negatively correlated taxa are marked with orange lines, with the thickness of the line indicating the significance of the correlation. Note that different taxonomical levels are shown. BCoAT, butyryl CoA:acetate CoA transferase.

