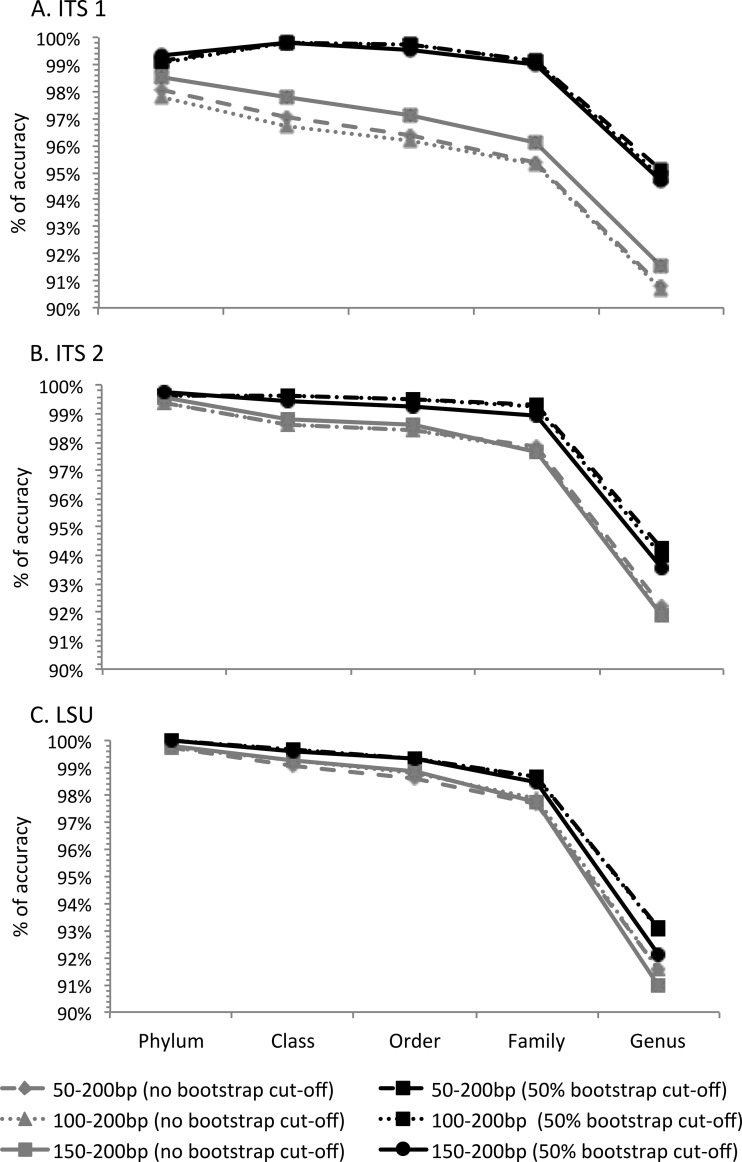
FIG 3.
Classification accuracy comparison for the ITS1, ITS2, and LSU regions using the naive Bayesian classifier without a bootstrap or with a 50% bootstrap cutoff. The y axis shows the percentages of LOOCV sequences that were accurately classified. (A) ITS1 region; (B) ITS2 region; (C) LSU region. Query sequences of three lengths were extracted using the primer-anchored method.

