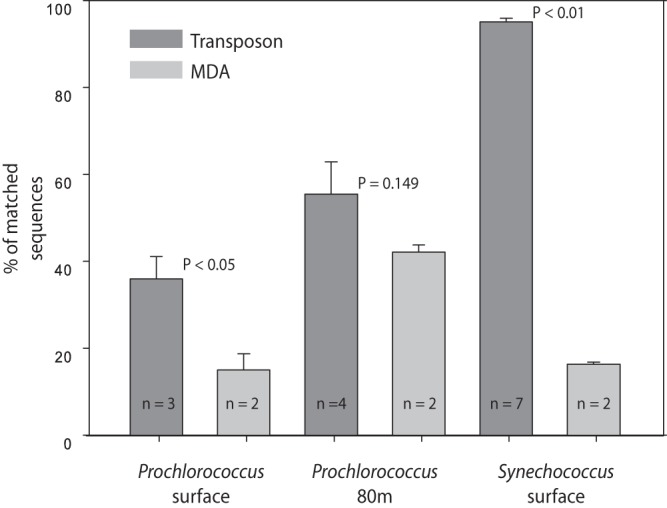
FIG 4.

Comparison of transposon-based and MDA methods estimated as the mean percentages of sequences that match the genome of interest. Error bars denote standard errors, and n is the number of samples. P values were calculated using Student's t test.
