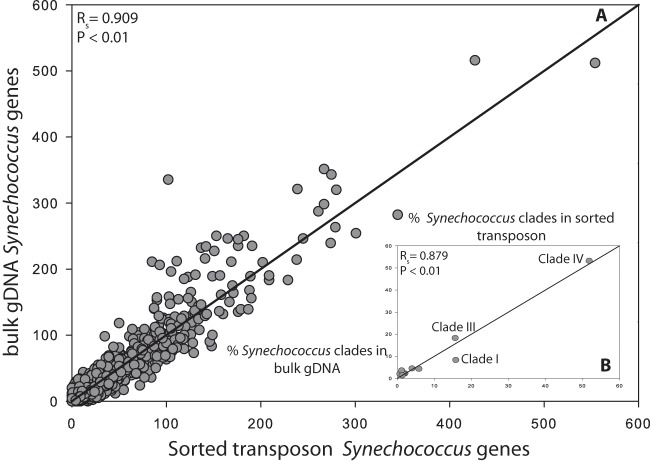
FIG 5.
Whole-genome comparison between two California Current samples: unsorted unamplified bulk seawater prepared with TruSeq Illumina and Synechococcus sorted transposon-based library preparation with Illumina sequencing. (A) Comparison between Synechococcus sorted transposon sample (x axis) and bulk unsorted environmental genomic DNA (gDNA) (y axis) from the California Current based on Synechococcus WH8102 gene abundance normalized to the same number of matched sequences. The correlation between gene abundances was determined using Spearman's rank test (Spearman's rank correlation coefficient [RSpearman] [RS in the figure] = 0.909; P < 0.01). Gray circles represent the abundance of each gene in a sample. (B) Comparison between the distribution of different Synechococcus clades present in the samples based on a BLAST analysis of 12 Synechococcus complete genomes (gray circles). The correlation between the distribution of clades was determined using Spearman's rank test (RSpearman = 0.879; P < 0.01). The black line is the (1,1) line for both panels.

