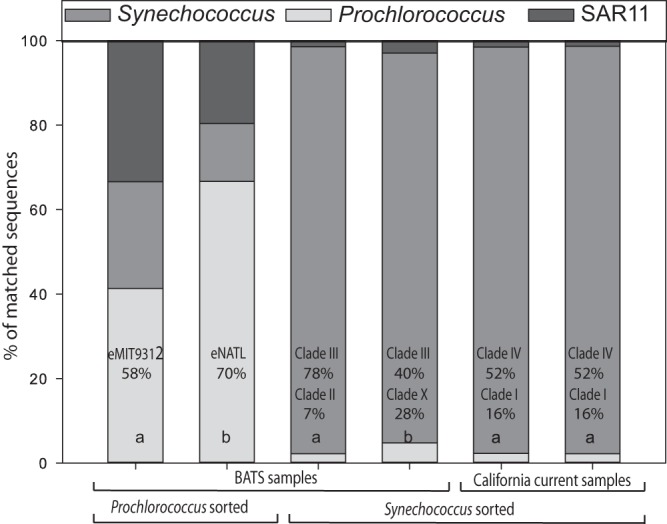
FIG 6.

Comparison of taxonomic profiles from Prochlorococcus and Synechococcus (surface water [a]) and water at a depth of 80 m) sorted environmental samples from BATS and California Current estimated from a whole-genome BLASTx approach. For each sample, we estimated the proportion of matched sequences from Prochlorococcus, Synechococcus, and SAR11 lineages. We also noted which clades the samples are most representative of.
