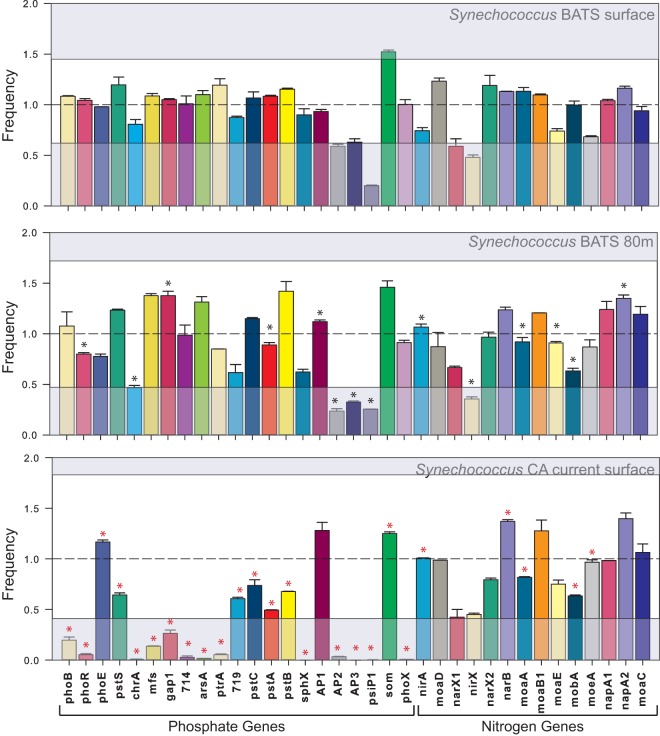
FIG 8.
Nitrogen and phosphate acquisition genes in Synechococcus sorted samples from BATS (surface and water from a depth of 80 m; samples taken in August 2010) and the California Current (surface water; samples taken in February 2011). Samples for transposon-based library preparations were prepared in duplicate samples, and the error bars represent the standard deviations between the abundances of each gene. Boxes and broken line are as explained in the legend to Fig. 7. Asterisks indicate statistically significant (P < 0.05 by Welch's t test) differences between the same genes at the two different depths (surface and 80 m) (black asterisks) and at the two locations (California [CA] current and BATS surface) (red asterisks) presented in the figure.

