FIG 8.
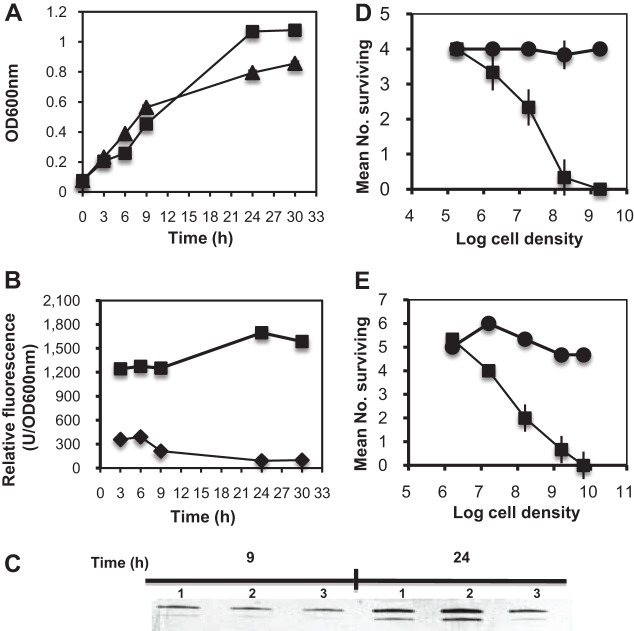
Growth and Cry11A production of recombinant strain SCH616 (GFP::Cry11A+P20). (A) Comparison of the growth of SCH616 (▲) and the WT (■). (B) Comparison of the green fluorescence emitted by SCH616 (■) and the WT (♦) grown in CYE medium supplemented with Em by fluorescence spectrometry (see Materials and Methods). The relative green fluorescence was normalized with the OD600. (C) Western blot analysis of GFP::Cry11A production by SCH616 and the WT. Cultures were sampled at 9 and 24 h, respectively. The cell number was adjusted to an OD600 of 0.1, and ca. 20 μl of cells was subjected to SDS-PAGE. Western blot analysis was performed as described in Materials and Methods. The control was F. hibernum WT strain W22. (D) Bioassay of SCH616 (■) and WT (∙) conducted with A. triseriatus larvae in water. Results were recorded after 24 h. Values are means ± standard deviations; n = 4. (E) Bioassay of SCH616 (■) and WT (∙) conducted with A. triseriatus larvae in a microcosm system. Results were recorded after 48 h. Values are means ± standard deviations; n = 6.

