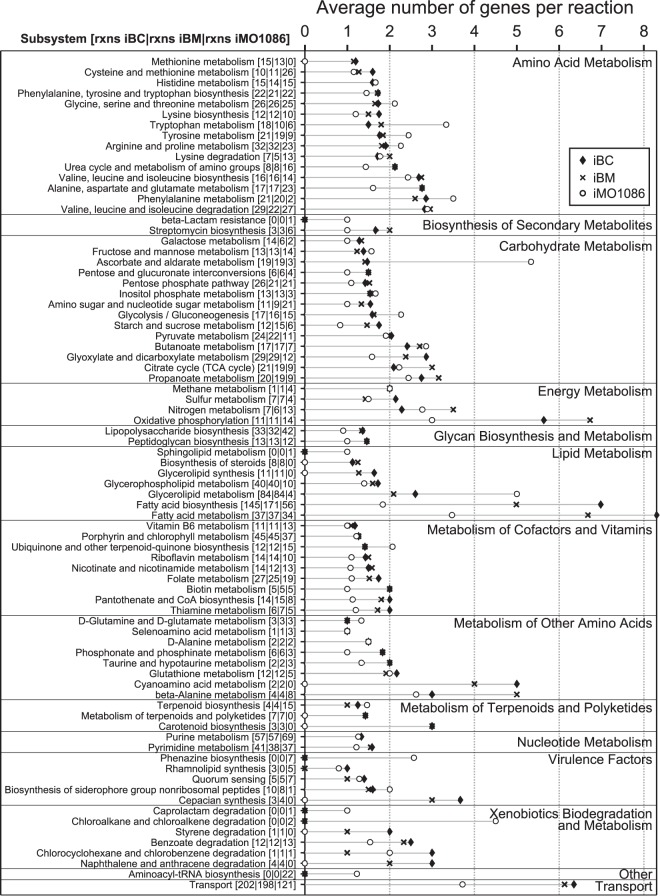
FIG 5.
Distribution of the number of genes per reaction in iBC and iBM by subsystem. The average number of genes per reaction per subsystem was calculated by dividing the total number of genes in the GPRs of the reactions (rxns) in each subsystem by the number of reactions in each subsystem. Solid diamonds and X's show the average number of genes per reaction for iBC and iBM, respectively. For reference, the average number of genes per reaction for iMO1086 (P. aeruginosa PAO1) is shown as open circles. For each subsystem, the three values in brackets denote the number of reactions for iBC, iBM, and iMO1086.

