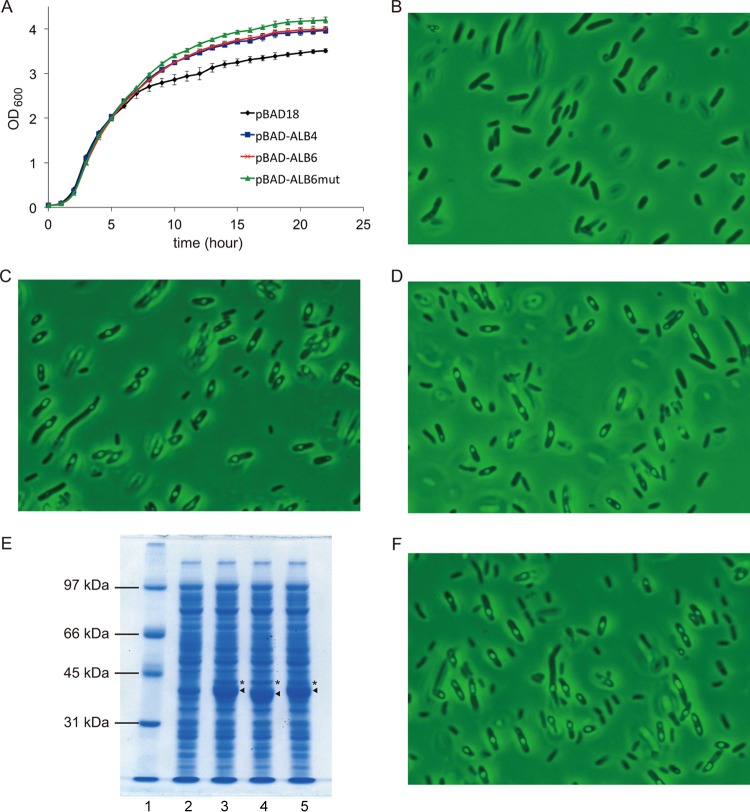
FIG 4.
Effect of the production of archaeal lipids on the growth and morphology of the host E. coli cells. (A) Growth curves of E. coli harboring the plasmids. (B to D) Photographs of the cells of E. coli harboring pBAD18, pBAD-ALB4 and pBAD-ALB6, respectively. (E) SDS-PAGE analysis of the crude extracts from E. coli expressing the archaeal enzymes. Lane 1, molecular marker; lanes 2 to 5, E. coli harboring pBAD18, pBAD-ALB4, pBAD-ALB6mut, and pBAD-ALB6, respectively. Arrowheads and asterisks indicate protein bands corresponding to GGPP synthase and G1P dehydrogenase, respectively. (F) Photograph of the cells of E. coli harboring pBAD-ALB6mut.

