
FIG 8.
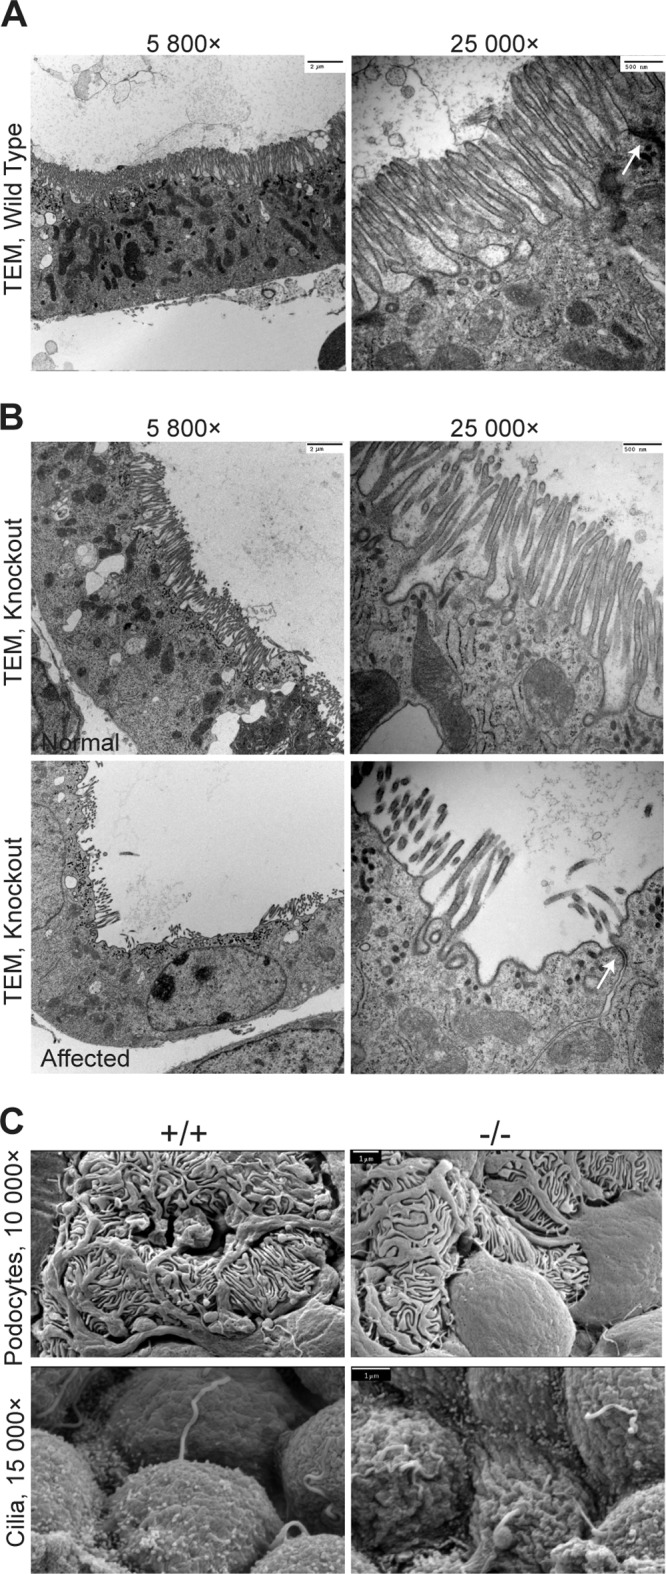
Electron micrographs of kidneys from Crumbs3-deficient mice. (A and B) Transmission electron micrographs of wild-type and knockout proximal tubules with brush borders from E18.5 kidneys (scale bars = 2 μm [left] and 500 nm [right]). Arrows indicate tight junctions. (C) Scanning electron micrographs of podocytes and cilia from E18.5 kidneys (scale bars = 1 μm).