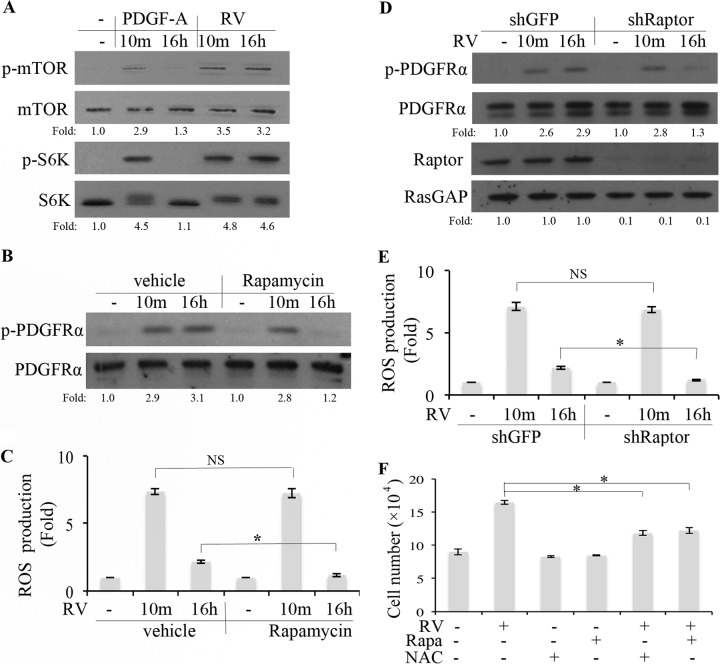
FIG 5.
RV stimulated mTORC1-dependent elevation of ROS, which was required for persistent activation of PDGFRα. (A and B) Near-confluent, serum-starved ARPE19α cells were pretreated with vehicle or rapamycin (100 nM) for 30 min and then stimulated with rabbit vitreous (RV) for 10 min or 16 h. The cells were harvested, and the resulting lysates were subjected to Western blot analysis with the following antibodies: pSer 2448 for p-mTOR and p-p70 S6 kinase for p-S6K. The fold values are the p-PDGFRα/PDGFRα ratio, the p-mTOR/mTOR ratio, or the p-S6K/S6K ratio. The data presented are representative of three independent experiments. (C) Cells were treated as described above for panel B and then washed, and the ROS level was determined as described in Materials and Methods. Values that are statistically significantly different (P < 0.05) are indicated by an asterisk and bar. Values that are not statistically significantly different are indicated by NS and a bar. (D) Near-confluent, serum-starved ARPE19α cells that stably expressed shRNA directed against gfp or raptor were treated with RV for 10 min or 16 h. The cells were lysed, and the resulting lysates were subjected to Western blot analyses using the indicated antibodies. The fold values are the p-PDGFRα/PDGFRα ratio or the Raptor/RasGAP ratio. The data presented are representative of three independent experiments. (E) Same as panel D, except that instead of lysing the cells for Western blot analysis, the level of ROS was determined as described in Materials and Methods. Values that are statistically significantly different (P < 0.05) are indicated by an asterisk and bar. Values that are not statistically significantly different are indicated by NS and a bar. (F) Serum-starved ARPE19α cells were cultured in medium containing RV, rapamycin (Rapa) (100 nM), or NAC (10 mM) for 3 days. The medium was refreshed daily, and the cells were counted at the end of day 3. These data are means ± standard deviations (SD) from three independent experiments. Values that are statistically significantly different (P < 0.05) are indicated by an asterisk and bar. Similar results were obtained when this experiment was repeated using primary human corneal fibroblasts instead of ARPE19α cells (data not shown).

