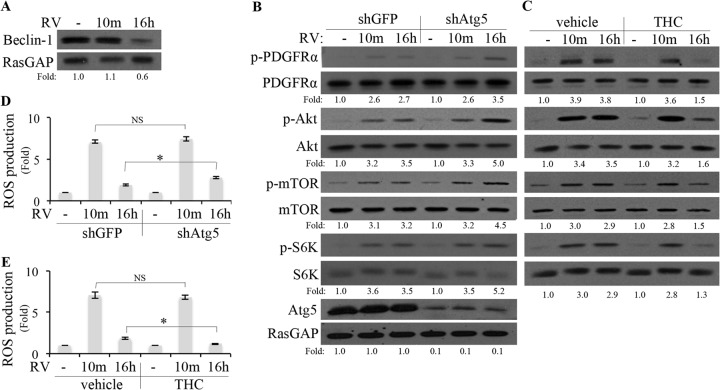
FIG 6.
Inhibition of autophagy was necessary for RV-mediated, persistent activation of PDGFRα. (A) ARPE19α cells were permitted to reach 70% confluence, serum starved, exposed to RV for 10 min or 16 h, and then lysed. The resulting lysates were subjected to Western blot analysis using the indicated antibodies. RasGAP served as a loading control. The fold values are the beclin-1/RasGAP ratio. The data presented are representative of three independent experiments. (B) Near-confluent, serum-starved ARPE19α cells that stably expressed shRNA directed against gfp or atg5 were treated with RV for 10 min or 16 h. The cells were lysed, and the resulting lysates were subjected to Western blot analyses using the indicated antibodies. (C) Near-confluent, serum-starved ARPE19α cells were pretreated with THC (5 μM) for 110 min, after which time RV was added and the cells were lysed 10 min later; the cells were exposed to drug and RV for 120 and 10 min, respectively. To monitor the effect of THC at the 16-h time point, the cells were first exposed to RV for 14 h and then THC was added and the cells were lysed 120 min later; the cells were exposed to THC and RV for 120 min and 16 h, respectively. The lysates were subjected to Western blot analyses using the indicated antibodies. In panels B and C, the fold values are the p-PDGFRα/PDGFRα ratio, the p-Akt/Akt ratio, the p-mTOR/mTOR ratio, the p-S6K/S6K ratio, or the Atg5/RasGAP ratio. The data presented are representative of three independent experiments. (D and E) Same as panels B and C, respectively, except that instead of lysing the cells for Western blot analysis, the level of ROS was determined as described in Materials and Methods. Values that are statistically significantly different (P < 0.05) are indicated by an asterisk and bar. Values that are not statistically significantly different are indicated by NS and a bar.

