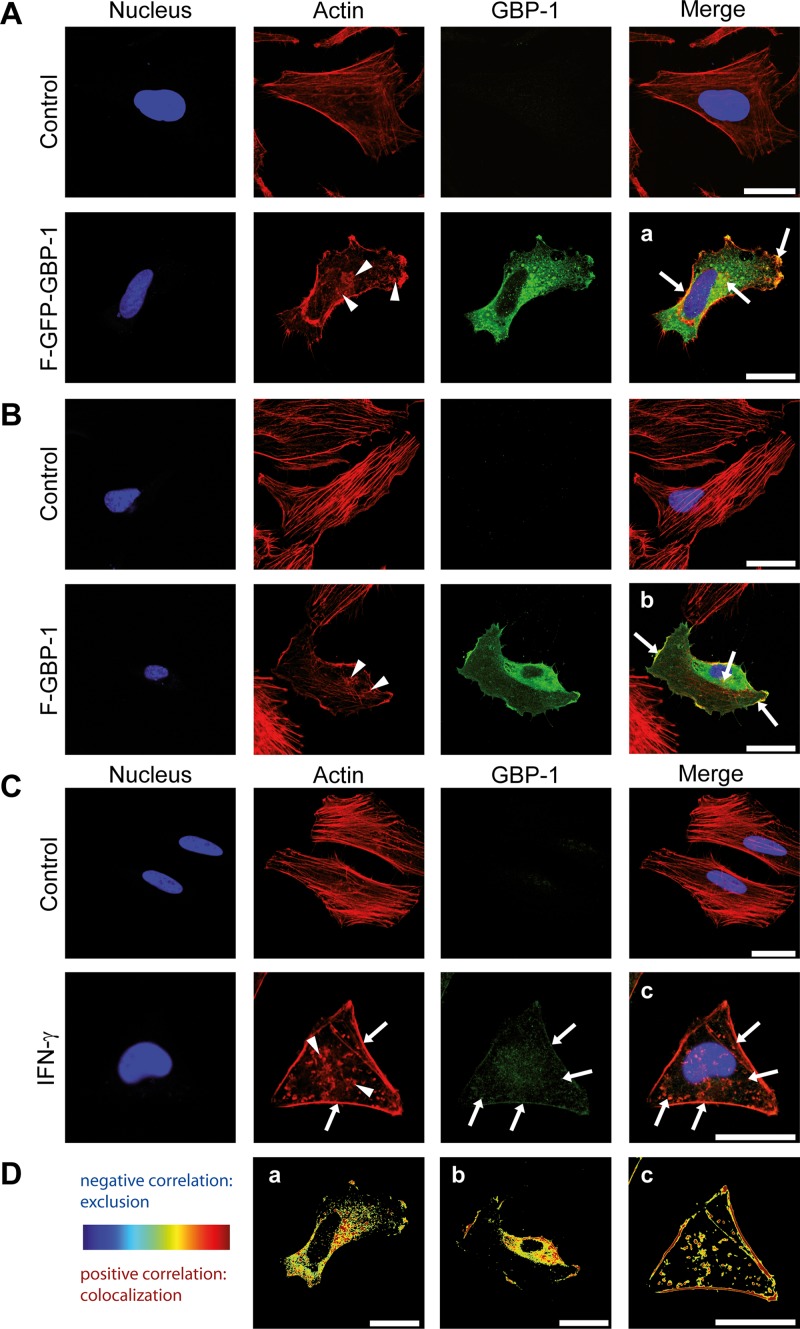
FIG 3.
GBP-1 colocalizes with cellular actin and disrupts the stress fibers of the actin cytoskeleton. Images were taken using a Leica TCS SPE confocal microscope with z-plane focusing on the attachment site of the cell culture slide. Nuclei were counterstained with Draq5. (A) HeLa cells were transfected with an expression plasmid for Flag- and GFP-tagged GBP-1 (F–GFP–GBP-1) or the empty parental vector (control). F–GFP–GBP-1 was visualized by the fluorescence of the GFP tag, and actin was visualized using Alexa Fluor 546-labeled phalloidin. Arrowheads, the disrupted actin structure, observed as a granular distribution of actin proteins in the cytoplasm of F–GFP–GBP-1-transfected cells; arrows, colocalization of actin and F–GFP–GBP-1 observed at the plasma membrane and actin aggregates. (B) HUVECs were transfected with either F–GBP-1 or the empty parental vector (control). GBP-1 was detected in a subsequent immunofluorescence staining using an antibody against the Flag tag. Actin was detected by a fluorescently labeled phalloidin. The staining pattern was similar to that described in the legend to panel A. Arrows, colocalization. (C) HeLa cells were either left untreated (control) or treated with IFN-γ (100 U/ml, 24 h). Endogenous GBP-1 was stained using a GBP-1 antibody and immunofluorescence analysis. Arrowheads, impaired actin cytoskeleton shown as actin aggregates throughout the cytoplasm; arrows, colocalization of GBP-1 and actin. (D) The images from panels A to C (a, b, and c, respectively) were quantified using the ImageJ Colocalization Colormap software. The results are presented as images using hot colors (red and yellow), which display a positive correlation, and cold colors (blue), which display a negative correlation. A clear colocalization of GBP-1 and actin at the cell membrane, granular structures, and actin aggregates is shown. All results were independently reproduced by a second researcher. Bars = 25 μm.

