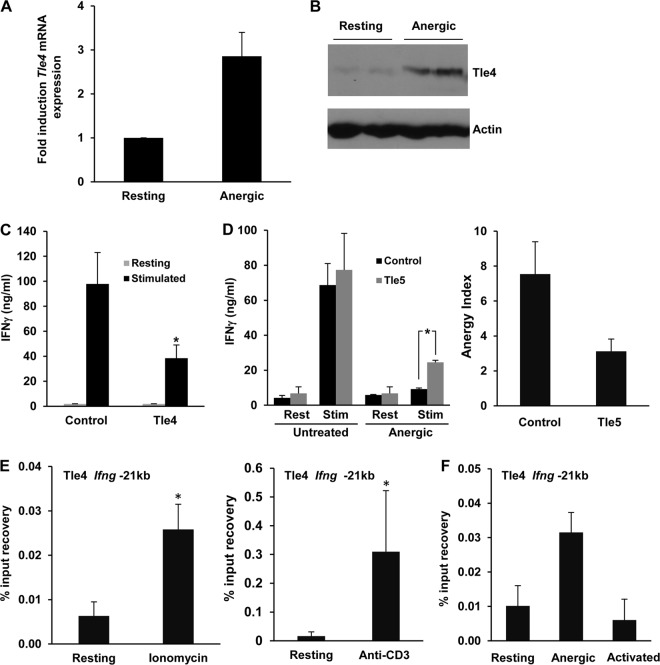
FIG 3.
Ifng is suppressed by Tle4 in anergic T cells. (A and B) Tle4 mRNA (A) and protein (B) in resting and anergic TH1 cells were quantified by RT-qPCR and immunoblotting, respectively. Data in panel A show means and SEM for 3 independent experiments. (C) IFN-γ expression in TH1 cells transduced with retroviruses expressing either GFP alone or GFP and Tle4 (Tle4). GFP+ cells were sorted and stimulated with anti-CD3 and anti-CD28 antibodies. IFN-γ production was measured by ELISA. Bars represent means and SEM for 3 independent experiments. *, P < 0.05. (D) IFN-γ production was measured in anergic control cells and cells expressing the Tle4 dominant negative protein, Tle5. TH1 cells were transduced with retroviruses expressing either GFP alone or GFP and Tle5 and were sorted for GFP expression. Cells were either left untreated or anergized and then stimulated (Stim) with anti-CD3 and anti-CD28 antibodies for 24 h. The anergy index value (ratio of IFN-γ produced by control cells and anergized cells) is also shown. Bars represent means and SEM for 3 independent experiments. *, P < 0.05. (E and F) Tle4 occupancy of the Ifng −21kb CNS was analyzed by ChIP using an anti-Tle4 antibody on resting TH1 cells, cells anergized with either ionomycin (E) or anti-CD3 treatment (E and F), and activated cells (F). Graphs show means and SEM for 6 and 2 independent experiments, respectively. *, P < 0.05.

