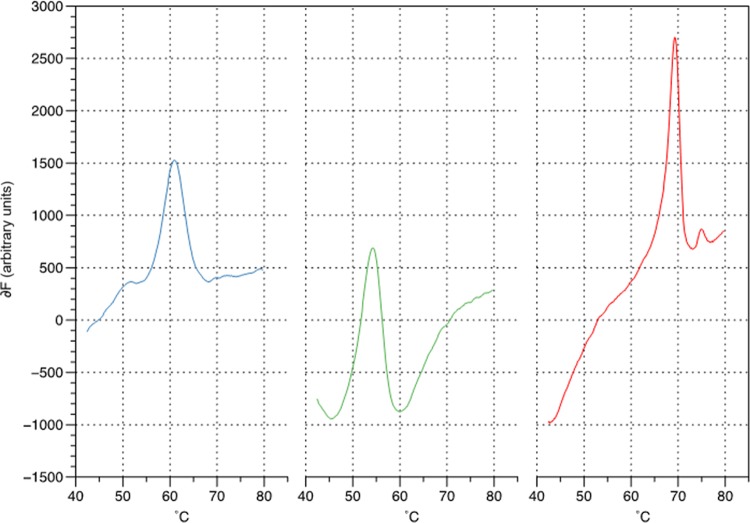
FIG 1.
Representative Highlighter Probe melt curve data from 5 copies of genomic DNA from cultured strain H37Rv (ATCC 25618, USA) amplified using the Genedrive system. The data show first-order derivative melt peaks for M. tuberculosis at 62°C (blue), internal positive control at 54°C (green), and RIF wild type (WT) at 69°C (red).

