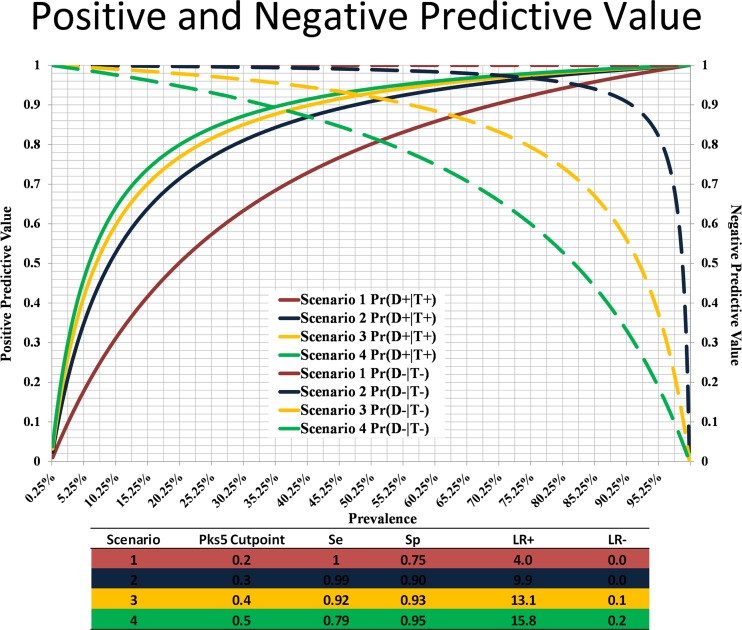
FIG 7.
Pks5 positive and negative predictive values and cutoff values based on bovine tuberculosis prevalence. Positive and negative predictive values were plotted against percent prevalence values. Cutoff values were assigned to 4 scenarios based on prevalence. Scenario 1, high bTB prevalence (red); scenario 2, moderate bTB prevalence (blue); scenario 3, moderate-low bTB prevalence (yellow); scenario 4, low bTB prevalence (green); Pr, probability; D(+/−), Disease or no disease; T(+/−), test result positive or negative.

