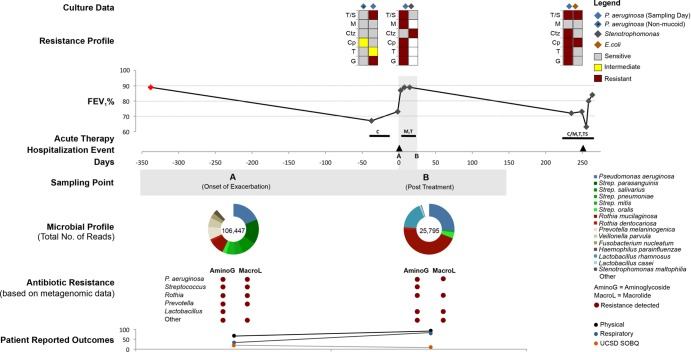
FIG 6.
An overview of clinical and metagenomic data in patient CF8. This patient was clinically defined as a responder. The FEV1% was illustrated across a 600-day period, and a red diamond indicates the baseline FEV1%. The resistance profile line shows the results from laboratory resistance tests on clinically cultured microbes, obtained at the time point immediately below their placement. The first sample was collected during the onset of a clinically defined exacerbation at time point 0. The medications prescribed during each chronic and acute round of therapy are shown in the time line. The length of the black line corresponds to the duration of therapy. Acute therapy is represented as follows: M, meropenem; Ctx, ceftriaxone; Ctz, ceftazidime; PT, piperacillin-tazobactam; Cp, ciprofloxacin; T, tobramycin; G, gentamicin; Pred, prednisone; Imp, imipenem; Azt, aztreonam; Lz, linezolid; Col, colistin; Ampho, inhaled amphotericin; and Cayston, inhaled aztreonam.

