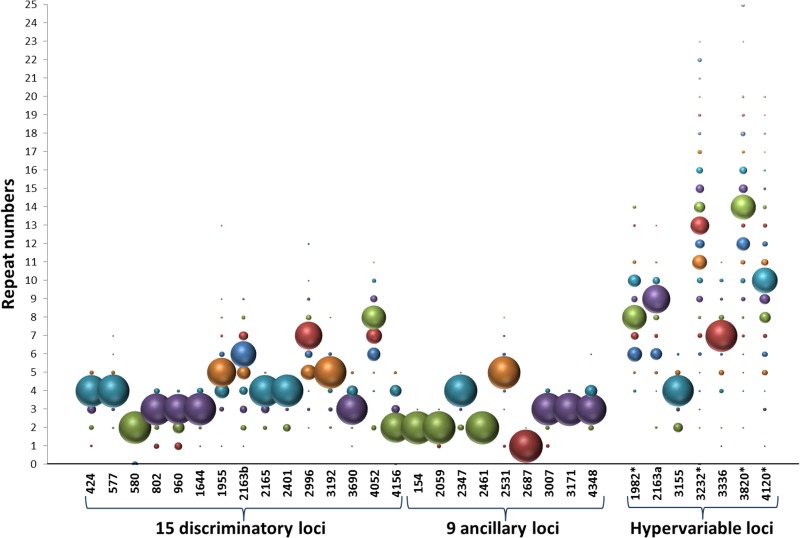
FIG 2.
Allelic distributions of the 31 markers on the global strain panel of 535 isolates. Bubble sizes are proportional to the frequencies of the different alleles detected for each marker. Bubble colors correspond to different alleles observed for each marker, with corresponding repeat numbers shown on the y axis. The 15 discriminatory loci and 9 ancillary loci compose the standard set of 24 markers. Hypervariable loci retained for the consensus set are marked by an asterisk. Markers are coded by conventional numbers indicating their position (in kbp) on the M. tuberculosis H37Rv chromosome.

