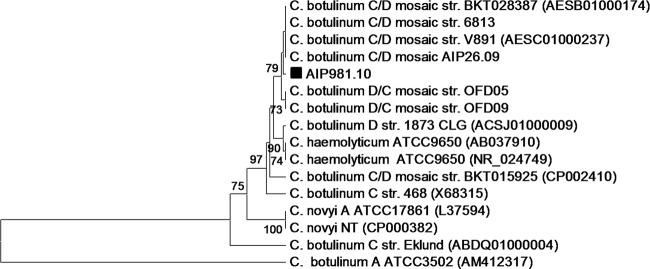
FIG 1.

16S rRNA gene analysis. The dendrogram was reconstructed from the nucleotide sequence of the gene by the unweighted-pair group method using average linkages (UPGMA) method. The genetic distances were computed by using the Kimura two-parameter model. The scale bar indicates the genetic distance. The number shown next to each node indicates the percent bootstrap value of 1,000 replicates. Evolutionary analyses were conducted in MEGA5 (8). Strain AIP981.10 is highlighted on the tree by a black square.
