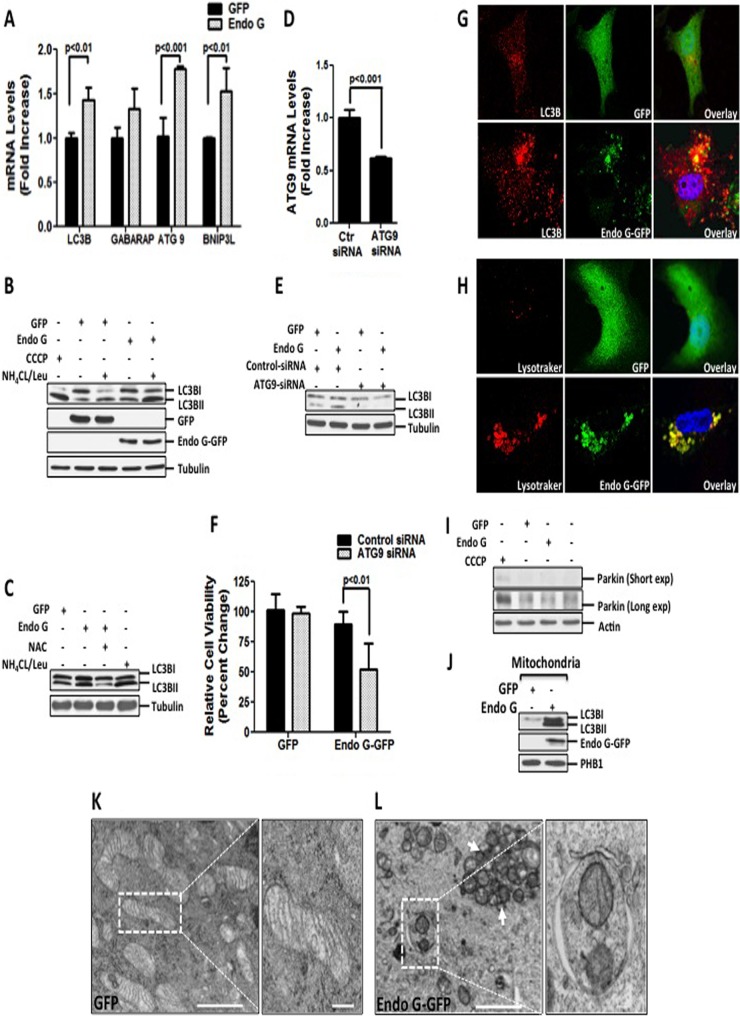
FIG 2.
ROS-mediated mitophagy is required to maintain the viability of cells undergoing proteotoxic stress. (A) mRNA levels of LC3B, GABARAP, ATG9, and BNIP3L were assessed by qRT-PCR in MDA-MB231 cells transfected with the indicated plasmids at 24 h. (B) MDA-MB231 cells were treated with 10 μM CCCP overnight or transfected with the indicated plasmids for 48 h, followed by treatment with a combination of 20 μM NH4CL and 0.1 mM leupeptin for 3 h prior to harvesting. Protein extracts were used for Western analysis of lipidated LC3BII. (C) Lysates from cells transfected with the indicated plasmids in the presence or absence of 5 mM NAC were used for Western analysis of LC3BII. (D) Efficiency of knockdown and ATG9 mRNA levels were evaluated by qRT-PCR of cells transfected with 20 nM siRNA against luciferase or siRNA against ATG9 followed by overexpression with Endo G-GFP for 48 h. (E) Crude extracts from MDA-MB231 cells transfected with either 20 nM siRNA against luciferase or 20 nM siRNA against ATG9, followed by transfection with the indicated plasmids, were analyzed by Western blotting for LC3B lipidation. (F) Viability of cells transfected as described below for panel H was determined by trypan blue staining at 48 h. (G) LC3B punctum formation was assessed by confocal microscopy in cells stained with anti-LC3B antibody (red) and counterstained with DAPI to visualize nuclei (blue), whereas Endo G-GFP or GFP is indicated in green. (H) Transfected cells loaded with LysoTracker Red (LTR) were analyzed by confocal microscopy to detect the overlay (yellow) of LTR-labeled acidic autolysosomal compartments (red) with GFP or Endo G-GFP (green). (I) Crude lysates from untreated cells or cells treated with 10 μM CCCP or transfected as indicated were tested for parkin by Western blotting. (J) Mitochondrial fractions were isolated from cells transfected with the indicated plasmids and subjected to Western blotting to detect levels of LC3BII. Overexpression of Endo G-GFP was confirmed by immunoblotting with Endo G antibody. PHB1 were used as a loading control for mitochondrial fractions. (K) GFP-overexpressing cells were subjected to electron microscopy (magnification, ×5,000; scale bar, 2 μm). Also shown is a higher-magnification view of mitochondria from the selected area (magnification, ×10,000; scale bar, 1 μm). (L) Electron micrographs of Endo G-GFP-overexpressing cells (magnification, ×5,000; scale bar, 2 μm) and a magnified view of the selected area indicating fragmented mitochondria engulfed in the autophagosome (magnification, ×20,000; scale bar, 0.5 μm).

