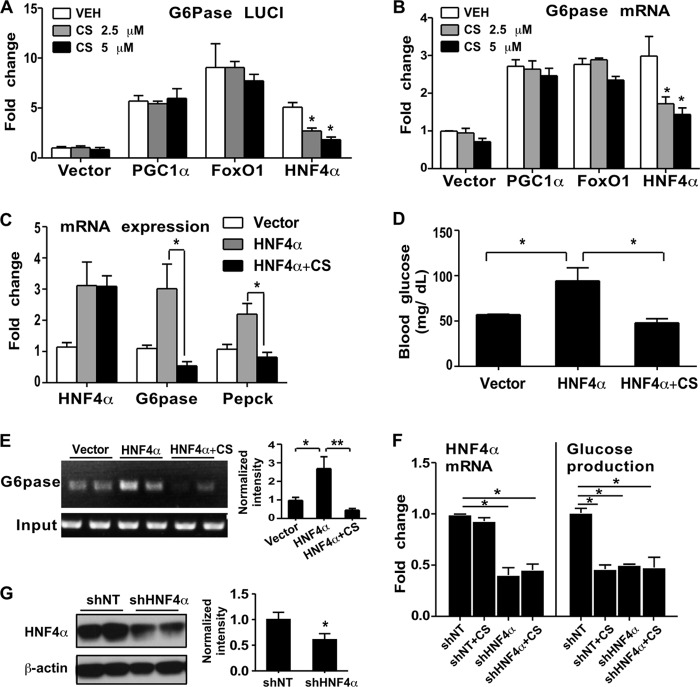
FIG 2.
CS inhibited the gluconeogenic activity of HNF4α. (A and B) Relative G6pase promoter luciferase reporter activity (A) and G6pase mRNA expression (B) in Hepa1-6 cells transfected with the indicated vectors. The cells were treated with a vehicle or with CS at 2.5 or 5 μM for 24 h. Results are means ± SD for three independent experiments. (C to E) Expression of hepatic G6pase and Pepck mRNAs (C), fasting blood glucose levels (D), and results of a ChIP assay of the livers of mice (E) after hydrodynamic transfection of the liver with the indicated vectors. The graph in panel E shows the quantification of ChIP assay results after normalization to input. n, 6 mice per group. (F) HNF4α mRNA expression and glucose production in Hepa1-6 cells infected with a lentivirus expressing HNF4α RNAi (shHNF4α) or a control RNAi (shNT). (G) (Left) The expression of HNF4α protein in shNT and shHNF4α cells was determined by Western blotting. (Right) Quantification of Western blotting results. Results are means ± SD for three independent experiments. *, P < 0.05; **, P < 0.01.

