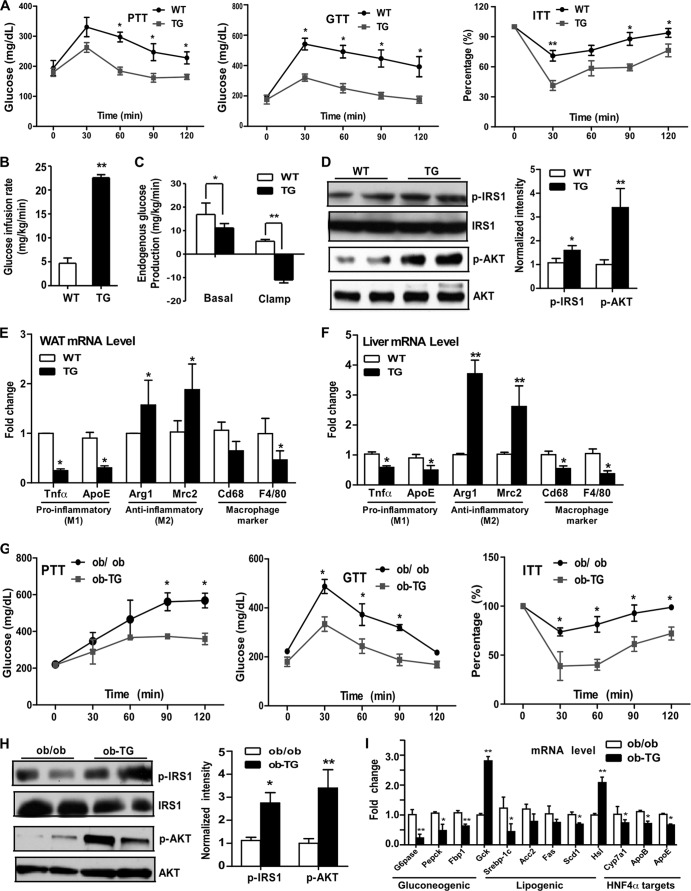
FIG 5.
Overexpression of SULT2B1b protected mice from diet-induced insulin resistance in the DIO and ob/ob models. (A to F) Mice were fed an HFD. (A) Pyruvate tolerance tests (PTT), glucose tolerance tests (GTT), and insulin tolerance tests (ITT). (B and C) Glucose infusion rate (B) and hepatic glucose production (C) during the hyperinsulinemic-euglycemic clamp procedure. (D) (Left) Insulin-stimulated phospho-IRS1 and phospho-AKT as shown by Western blotting. (Right) Bar graph showing quantification of the Western blot results. (E and F) mRNA expression of proinflammatory genes (M1), anti-inflammatory genes (M2), and macrophage marker genes in the WAT (E) and liver (F). (G to I) ob-TG mice were created by breeding the TG mice into the ob/ob background. Both ob/ob and ob-TG mice were maintained on a chow diet. (G) PTT, GTT, and ITT. (H) (Left) Insulin-stimulated phospho-IRS1and phospho-AKT as shown by Western blotting. (Right) Bar graph showing quantification of the Western blot results. (I) Hepatic gene expression as measured by real-time PCR analysis. Results are means ± SD; n, 4 to 8 mice per group. *, P < 0.05; **, P < 0.01. The percentages in panels A and G are relative variations from the time 0 min, which was arbitrarily set as 100%.

