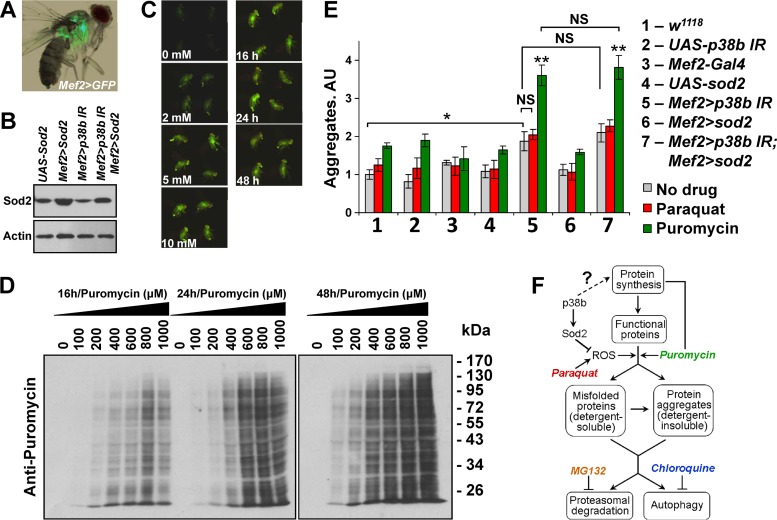
FIG 2.
p38MAPK regulates protein aggregate accumulation independently of ROS control. (A) Mef2-Gal4 driver used throughout the study directs tissue-specific expression in adult thoracic muscle (visualized by UAS-GFP). (B) Ectopic expression of MnSOD (Sod2) in thoracic muscle. Thoracic extracts from flies carrying indicated transgenes were examined by Western blotting. Mef2-Gal4 driver was used to express UAS-Sod2 and UAS-p38b IR responders. (C) Flies carrying a glutathione S-transferase D1 (GSTD1)–GFP construct were fed paraquat-supplemented food (concentrations are indicated below the images), and GFP expression was documented at 24 h (left row). Images for four flies from replicate vials are shown as fluorescent photographs. No increase in GFP intensity is observed at between 5 and 10 mM paraquat. GSTD1-GFP flies were fed 5 mM paraquat-supplemented food and imaged at the indicated time points. Robust activity of the GSTD1 promoter is observed at 16 h after treatment (right row). (D) Incorporation of puromycin into polypeptides in thoracic muscle was examined by feeding w1118 flies drug-supplemented food, followed by Western blotting. The following concentrations of puromycin were tested at each of the indicated time points: 0, 100, 200, 400, 600, 800, and 1,000 μM. Puromycin effectively incorporates into newly synthesized peptides at 16 h and a concentration greater than 400 μM. (E) p38b may control aggregate deposition independently of the Mef2/Sod2 pathway. The effect of a 16-h exposure to oxidative (paraquat) and proteotoxic (puromycin) stress on protein aggregate deposition in muscle was measured by dot blot analyses of extracts. Inverted-repeat-based RNAi line (UAS-p38b IR) was used to knock down p38b expression. The effects of drug treatments were confirmed by using a GSTD1-GFP reporter and Western blotting for paraquat and puromycin, respectively. Columns represent means ± the SD (n = 3; NS, not significant; *, P < 0.05; **, P < 0.01 [unpaired two-tailed Student t test]). (F) Schematic representation of main proteostatic pathways. Chemical modulators of proteostasis are color-coded to match the bar graphs in panel and Fig. 3B.

