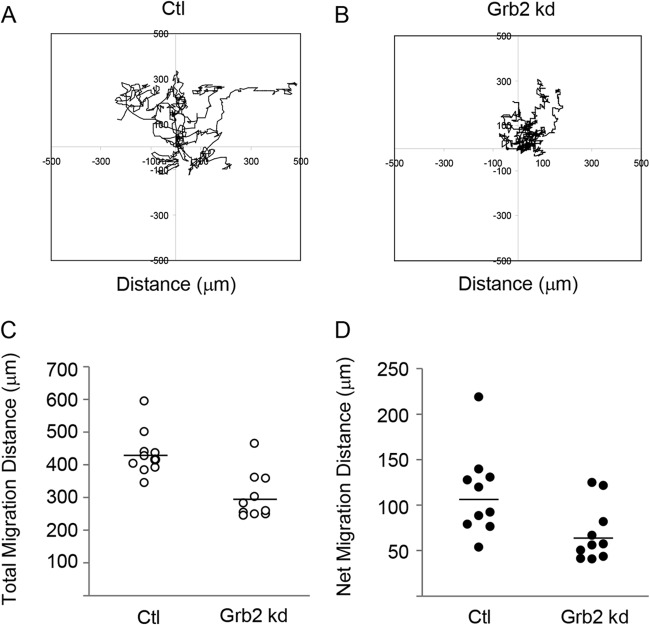
FIG 2.
Cell migration is reduced in the absence of Grb2. The migration of control (Ctl) and Grb2 siRNA-treated wild-type MEFs into the cleared area of a wounded cell monolayer was monitored for 24 h by time-lapse live-cell microscopy. Cell movement was tracked using ImageJ MtrackJ plugin. The two-dimensional (2D) random migration of 10 cells from each of the control (A) and Grb2 siRNA-treated (B) cell groups was measured and graphed. (C) The total distance of each track was measured for 10 cells in each group. The means are shown as horizontal bars and are significantly different (P = 0.001). (D) The net (linear) distance traveled was measured from the starting point of a track to the end. Results from 10 cell tracks are shown for each group. The means are shown as horizontal bars and are significantly different (P = 0.023).

