FIG 1.
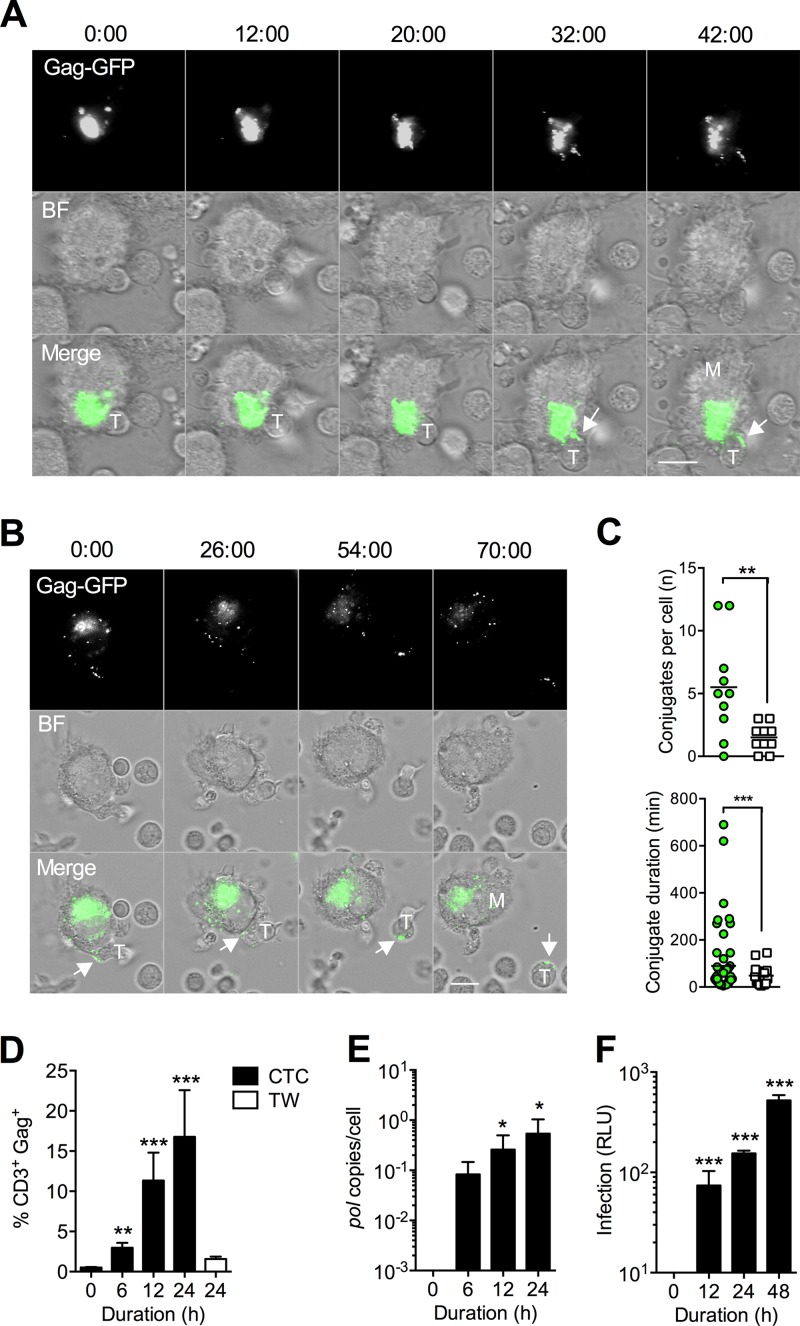
Rapid HIV-1 transfer from the VCC results in productive T cell infection. (A) Live-cell time-lapse imaging of HIV-1NL-Gag-GFP-JRFL-infected MDM and autologous CD4+ T cell cocultures. Images were acquired every 2 min for up to 6 h, and minutes after initiation of coculture are shown above stills from time-lapse series. HIV-1 Gag transfer from an MDM (labeled “M”) to a T cell (labeled “T”) at the VS is arrowed. Gag-GFP, signal from Gag-GFP infecting virus; BF, bright-field illumination; Merge, merged Gag-GFP and BF signals. (B) Detachment of a Gag+ T cell following VS-mediated transfer at 54 min. Scale bar, 10 μm. (C) Image analysis of conjugate frequency (number of conjugates formed per MDM; left) and duration (min; right) was performed with long-term imaging (every 5 min for 12 h) of HIV-1NL-GFP-BaL-infected MDM (n = 10 MDM for each condition, MDM+ and MDM−). Green circles, infected MDM; open squares, uninfected MDM. Conjugates were scored if they persisted >5 min and were present in two sequential images. **, P < 0.01; ***, P < 0.001 (t test). (D) Kinetics of Gag transfer measured using a flow cytometry transfer assay. Bars, means ± standard errors of the means (SEM) for 10 independent donors (n = 4 for transwell). **, P < 0.01; ***, P < 0.001 (ANOVA with Dunnett's posttest compared to t = 0). TW, cell-free exposure through a virus-permeable 3.0-μm transwell membrane. (E and F) CD4+ T cells were gently aspirated after coculture with infected MDM at a 1:1 ratio and analyzed for productive infection by qPCR for HIV-1 pol (HIV-1BaL-infected MDM; means ± SEM from 4 independent donors) (E) or luciferase expression (HIV-1NL-LucR-T2A.BaL-infected MDM; means ± SEM from 3 independent donors) (F). *, P < 0.05; ***, P < 0.001 (ANOVA with Dunnett's posttest compared to t = 0). An arbitrary value of 0.1 (D) or 1 (E) was added to all data to permit log transformation prior to analysis. RLU, relative light units.

