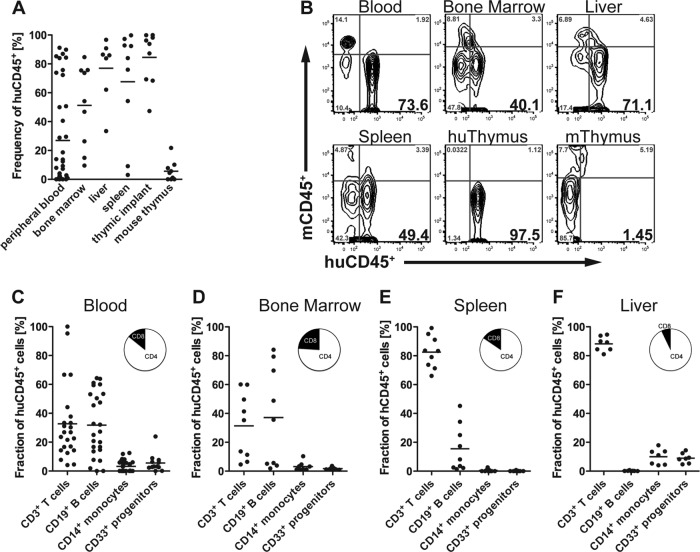
FIG 1.
Reconstitution of humanized BLT-NOD/SCID mice with human hematopoietic stem cells. (A and B) Frequencies (percentages) (A) and representative flow cytometry plots (B) of human CD45+ lymphocytes (huCD45+) in peripheral blood, bone marrow, liver, spleen, human thymic implant (huThymus), and mouse thymus (mThymus) at 16 weeks posttransplantation (n = 6 to 20 mice per group). Numbers in bold in the bottom right quadrants represent the percentage of mCD45− huCD45+ cells. (C to G) Human lymphocyte reconstitution in peripheral blood (C), bone marrow (D), spleen (E), and liver (F) with CD3+ T cells, CD19+ B cells, CD14+ monocytes, and CD33+ myeloid progenitor cells. The pie chart insets represent percentages of CD3+ CD4+ T helper cells (white) and CD3+ CD8+ cytotoxic T cells (black).

