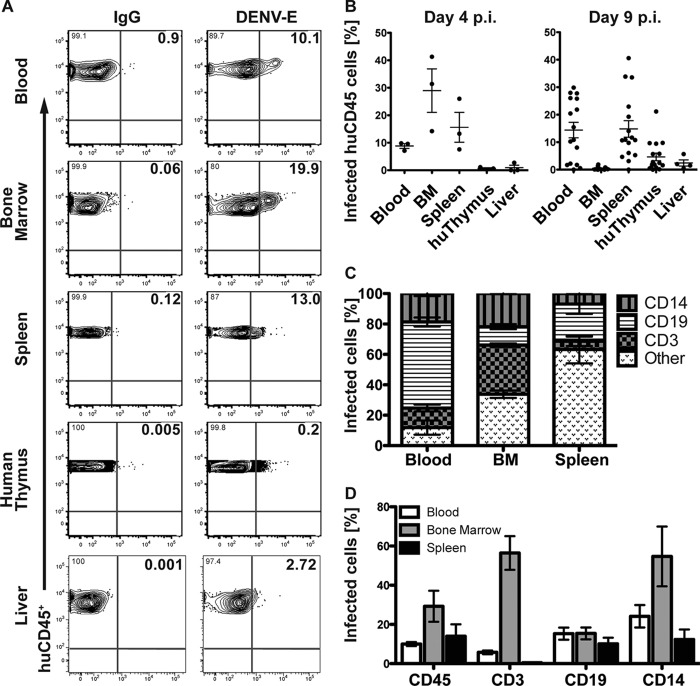
FIG 3.
Cellular tropism of DENV in different organs in infected BLT-NOD/SCID mice. (A) Representative flow cytometry plots of human CD45+ leukocytes infected with DENV-2 Col. Single, live cells were doubly gated for human CD45+ cells from the indicated body compartments and DENV envelope protein (DENV-E) or IgG (control) at day 4 postinfection. Bold numbers in top right corners of the graphs represent percentages of double-positive stained cells. (B) Frequency of DENV-E antigen-expressing cells in human CD45+ leukocytes from the indicated organs at days 4 and 9 following DENV-2 Col inoculation. Plots represent the means and standard errors of the means (SEM) for 3 mice (day 4) or 16 mice (day 9). For liver samples, data corresponding to 3 mice (day 4) or 6 mice (day 9) are presented. (C) Frequency of distinct CD45+ leukocyte populations infected by DENV in blood, bone marrow, and spleen at day 4 postinfection. Plots represent mean with SEM for 3 mice. (D) Percentage of infected human CD45+ leukocytes, CD3+ T cells, CD19+ B cells, and CD14+ monocytes from the indicated body compartments at day 4 postinfection. Plots represent mean with SEM for 3 mice. BM, bone marrow.

