FIG 6.
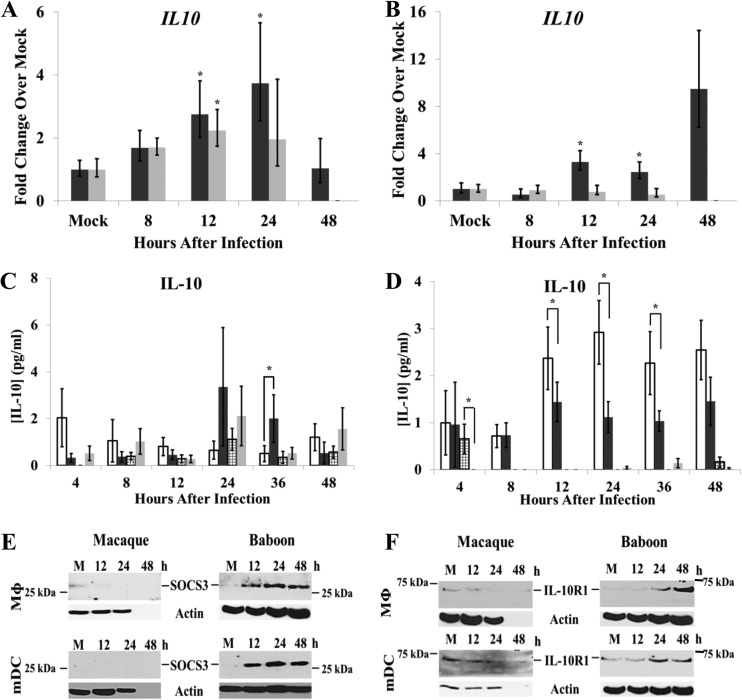
IL-10 production in primary NHP cells. Total cell RNA was isolated from cultured MΦs (A) and mDCs (B) at different times after mock infection or infection with SHFV (MOI of 1.0), and IL-10 mRNA levels were analyzed by real-time qRT-PCR. Each sample was assayed in triplicate. Each value was normalized to the level of 18S rRNA in the same sample. The data shown are averages of values from cell cultures prepared from seven baboons (black bars) and six macaques (gray bars). IL-10 protein levels in culture fluids collected from MΦs (C) and mDCs (D) were quantified by ELISA. Values shown are averages of data obtained from cultures from 10 baboons (white bars, mock infection; black bars, infected) and 8 macaques (stippled bars, mock infection; gray bars, infected). Error bars represent the standard error of mean. *, P ≤ 0.05. SOCS3 (E) and IL-10R1 (F) protein levels were detected by Western blotting in mock- and SHFV-infected (MOI of 1) MΦ and mDC lysates. Actin was used as a loading control. The data shown are representative of data from three independent experiments.

