FIG 9.
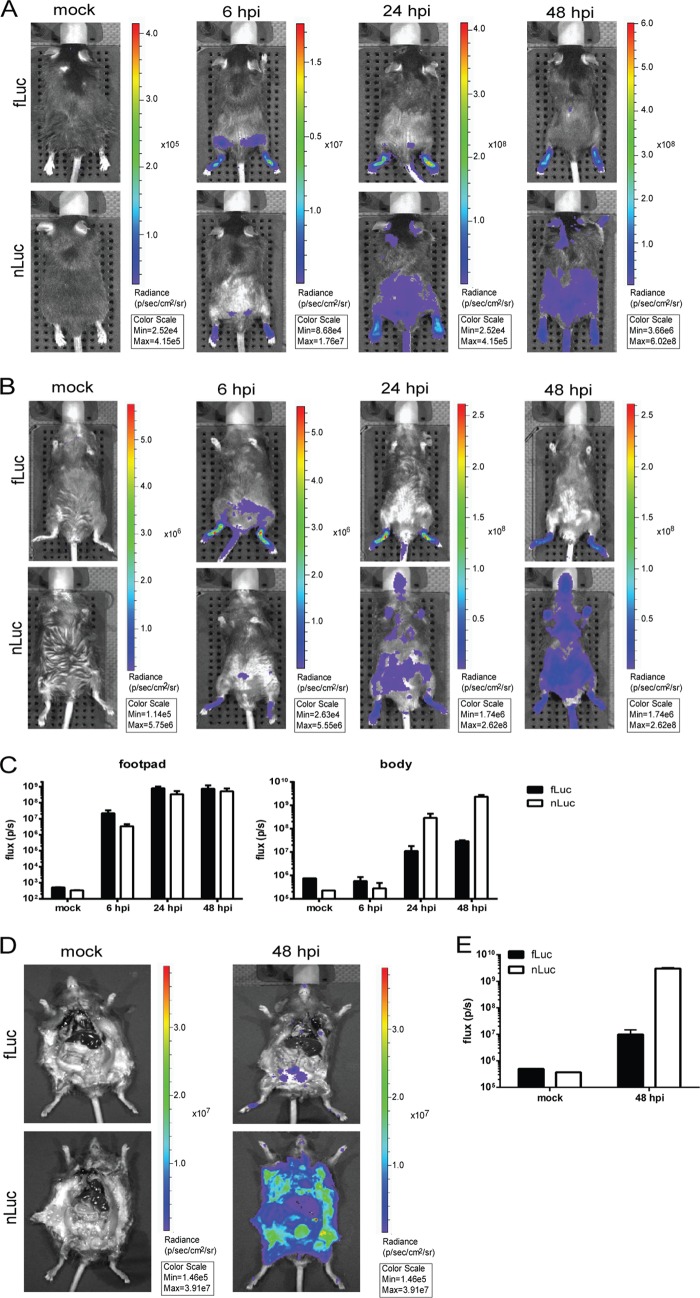
Longitudinal in vivo imaging of SINV nLuc-TaV and fLuc-TaV viruses in IFNAR1−/− mice. Mice were infected with 39nLuc-TaV or 39fLuc-TaV viruses and imaged for 2 s as described in Materials and Methods at 6, 24, or 48 h p.i. with the dorsal side (A) or ventral side (B) toward the camera. “Mock” indicates mice that were left uninfected but administered the respective luciferase substrate. Luminescence was quantitated from three mice for the footpad injection sites or whole body excluding the injection site using the ventral view (C). At 48 h p.i., the chest and peritoneal cavities of mice were exposed (D) and luminescence quantitated for the whole body as described above (E). Images are of one representative mouse of 3 infected per group. Error bars indicate standard deviations.

