
FIG 1.
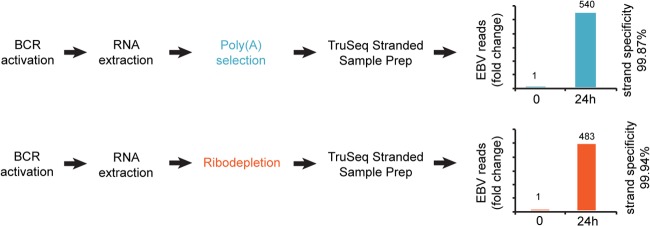
Reactivation and sequencing strategy. Column charts represent fold change in the number of RNA-seq reads mapped to the EBV genome, excluding EBER regions, at 0 and 24 h. For the calculation of strand specificity, see Materials and Methods.
Official websites use .gov
A
.gov website belongs to an official
government organization in the United States.
Secure .gov websites use HTTPS
A lock (
) or https:// means you've safely
connected to the .gov website. Share sensitive
information only on official, secure websites.
Reactivation and sequencing strategy. Column charts represent fold change in the number of RNA-seq reads mapped to the EBV genome, excluding EBER regions, at 0 and 24 h. For the calculation of strand specificity, see Materials and Methods.