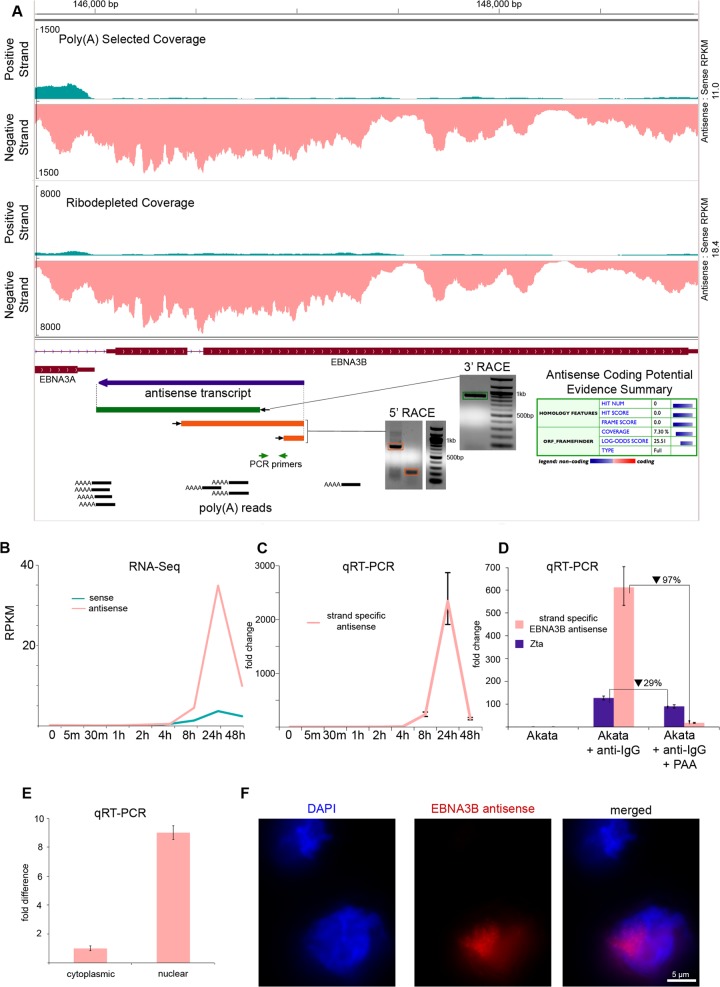
FIG 7.
Sense and antisense transcription at the EBNA3B locus (A) RNA-seq read coverage from poly(A) selected and ribodepleted RNA. Blue annotation tracks represents consensus from RACE fragments. Green annotation track represents a 3′ RACE fragment (band indicated by green box on gel). Orange annotation tracks indicate 5′ RACE fragments (bands indicated by boxes on gel). Poly(A) reads track illustrates RNA-seq reads mapping partially to poly(A) tails. Coding potential evidence summary is from the Coding Potential Calculator. (B) RPKM values for RNA-seq time course using ribodepleted RNA. (C) Relative abundance of antisense transcription from 0 to 48 h measured by strand-specific qRT-PCR. Primer placement is shown in panel A. (D) Relative abundance of antisense transcription at 24 h after treatment with anti-IgG, anti-IgG plus PAA, or nothing (control). Results were obtained by strand-specific qRT-PCR. (E) Relative abundance of antisense transcription in the nucleus and cytoplasm at 24 h after treatment with anti-IgG. Results were obtained by strand-specific qRT-PCR. (F) FISH of antisense transcripts.

