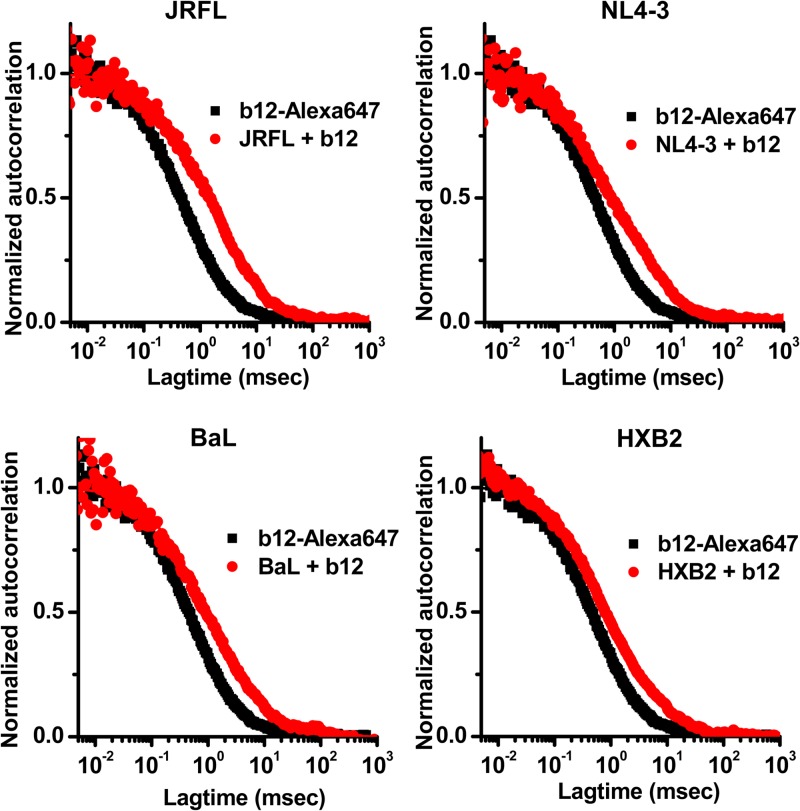
FIG 1.
Correlation spectroscopy curves for the interaction of Alexa 647-labeled MAb b12 with various types of virus particles. Autocorrelation curves obtained with antibody (6.6-μg/ml final concentration) alone are shown in black; those obtained with antibody in the presence of the indicated viruses are shown in red. The experiment was repeated three times with similar results.

