
FIG 6.
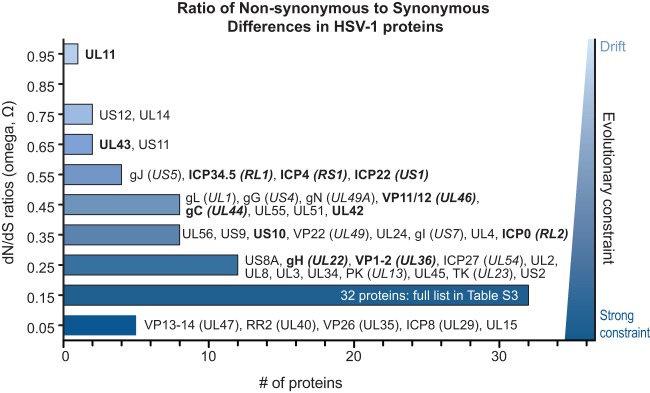
Distribution of Ω substitution rates for all HSV-1 proteins. Histogram of the number of HSV-1 proteins at each Ω substitution rate (in bins of 0.1, centered around the values shown). An Ω value of 1 indicates neutral selection or drift (light blue), whereas an Ω value of 0 indicates absolute constraint (dark blue). Protein names are listed next to each bin for all but the largest bin (0.1 to 0.19; see Table S3 in the supplemental material for list of all values). Protein names in boldface show signs of positive selection of individual amino acid residues (see Table 4). The average Ω value of 0.27 indicates that weak evolutionary constraint is the most common mode of protein evolution, while a few proteins approach levels indicating drift (UL11, US12, and UL14) and several others show strong selective constraint (UL15, VP26 [UL35], VP13-14 [UL47], RR2 [UL40], and ICP8 [UL29]). The Ω values reflect the overall amino acid sequence conservation values listed in Table 2.