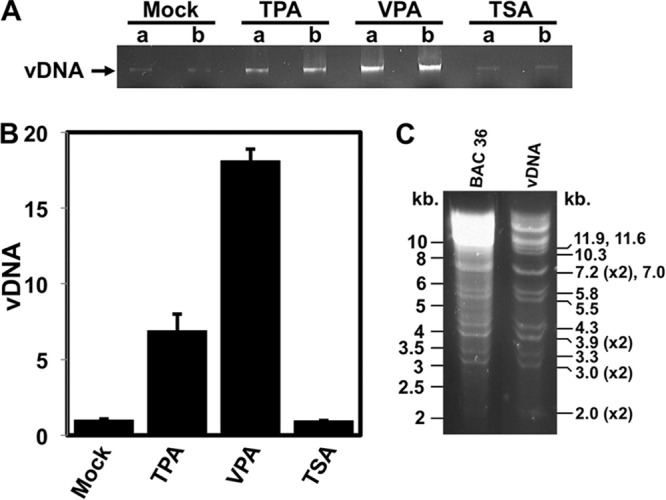
FIG 4.

HDAC inhibitor-specific reactivation of KSHV. The indicated inducers were added to the medium of BCBL-1 cells. Reactivation was scored 5 days following treatment by quantitating equal volumes of virion-encapsidated DNA by agarose gel electrophoresis and ethidium bromide staining (A) and by ImageJ densitometry (B). Fold reactivation was calculated by comparison to the level for solvent (mock)-treated cells, which was normalized to 1-fold. In panel A, lanes a and b denote experimental replicates. (C) Purified virion-associated DNAs (from the experiment whose results are shown in panel A) and BAC36 (control) were digested with HindIII and compared by agarose gel electrophoresis and ethidium bromide staining. Numbers to the left indicate the sizes of the bands in DNA molecular size standards. Numbers to the right indicate the sizes of the HindIII restriction fragments of the KSHV genome.
