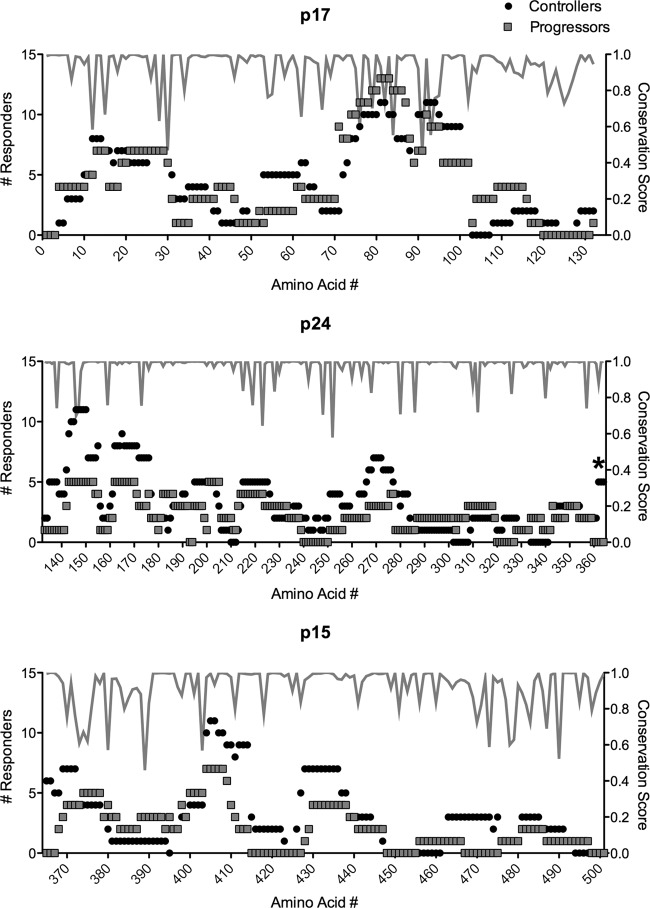
FIG 2.
Controllers and progressors target conserved and variable regions of Gag. Data represent the number of controllers and progressors that target each amino acid residue in Gag p17 (top), p24 (middle), and p15 (bottom panel), as well as the conservation score for each residue (gray line). *, P < 0.05.

