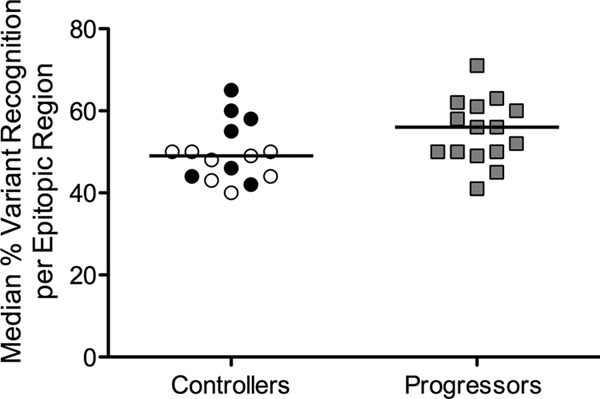
FIG 3.

Higher variant recognition in progressors. Epitope variant recognition is measured as the number of 11mers recognized per number of 11mers tested in a targeted epitopic region. For each study subject, the median percentages of variant recognition were calculated across all targeted epitopic regions and compared between controllers and progressors (P = 0.05). EC, black circles; VC, open circles; progressors, gray squares.
