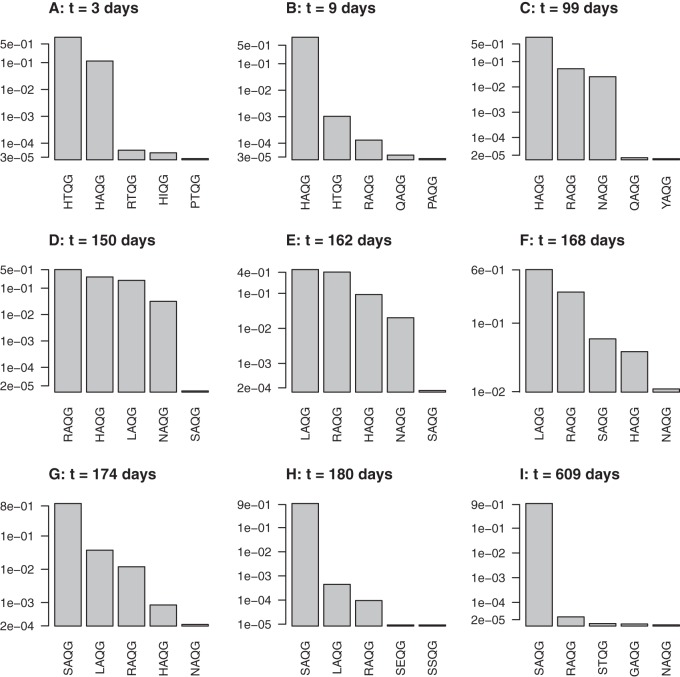
FIG 9.
Time evolution of quasispecies composition during the H5-to-H3 adaptation of the model influenza virus segment, simulated under the empirically inferred fitness landscape of Fig. 8B. Panels A to I show the sequential snapshots at each time instance (immediately after a passage cycle), listing five genotypes with the highest frequencies (shown in logarithmic scale). The parameter values were as follows: V0 = 1 × 10⁴, U0 = 1 × 10⁶, a = 1.0 × 10⁻³ day−1, b = 1.0 day−1, μ = 1 × 10⁻⁵, and τ = 3 days.

