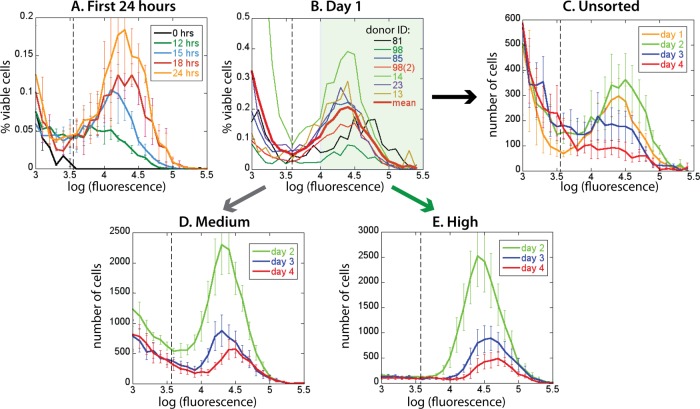
FIG 1.
Fluorescence distributions obtained in different phases of experiment. (A) The first EGFP+ cells appear 12 h postinfection, and their number and fluorescence increase during the first 24 h. (B) Fluorescence distributions of all donor samples on day 1 have similar positions of peaks, although they differ in the fraction of EGFP+ cells. On day 1, cells were FACS sorted into EGFP-medium (103 < F < 104; inside the white region in panel B) and EGFP-high (F > 104; inside the green region in panel B). (C) Averaged fluorescence distributions of unsorted samples on day 1, day 2, day 3, and day 4 show that EGFP+ cell numbers and fluorescence first increase and later decrease (from day 2 onward). However, in the sorted EGFP-medium (D) and EGFP-high (E), cell numbers decline monotonically while fluorescence is not changing much. The dashed vertical lines in panels A to C represent the EGFP+ gate. Error bars represent variations in cell proportions (A) or numbers (C to E) across donor samples.

