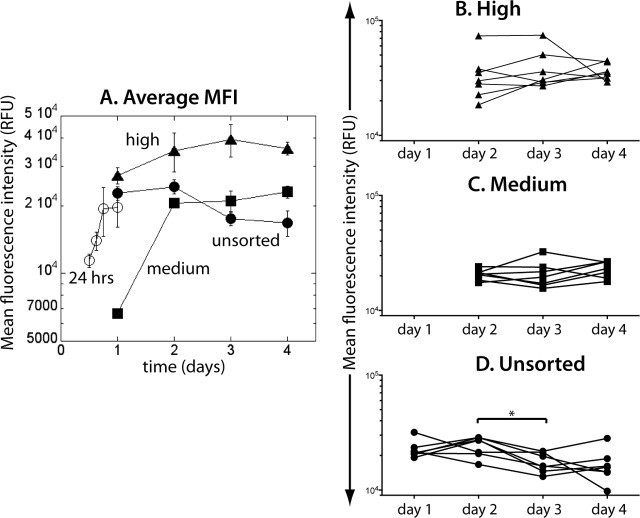
FIG 2.
Change of the average mean fluorescence intensity over time. During the first 24 h of infection, MFI increases monotonically (open circles in panel A). On day 1, cells were sorted into EGFP-medium (solid squares) and EGFP-high (solid triangles) and were followed in parallel with the unsorted cells (solid circles). (B and C) From day 2, neither MFI of EGFP-high nor of EGFP-medium changed significantly. (D) In the unsorted samples, MFI dropped significantly between day 2 and day 3.

