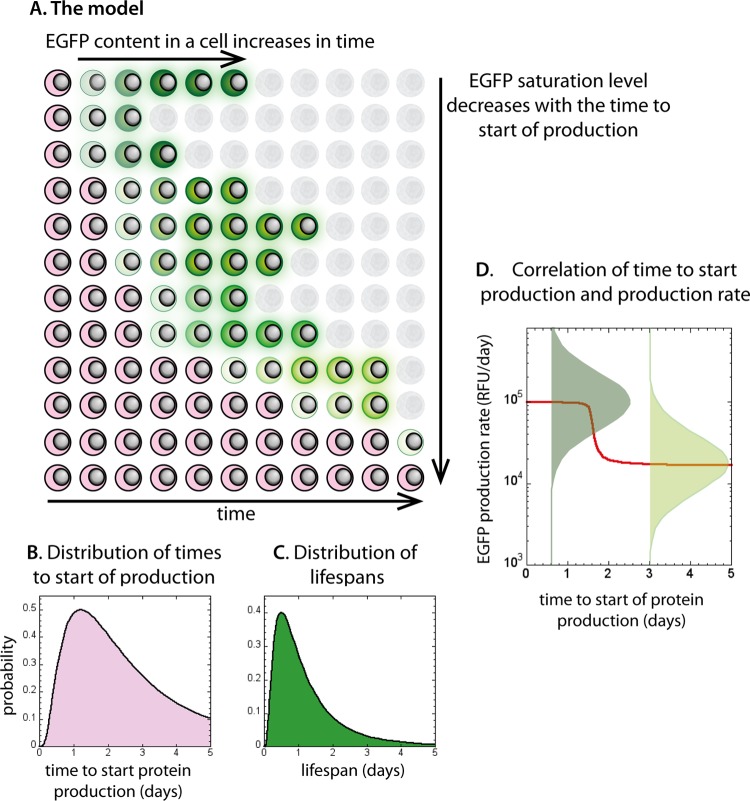
FIG 5.
The model and parameters used in simulation. Schematic representation of the model is shown in panel A. Cells with integrated HIV that have not yet started protein production are shown in pink. They start producing viral proteins at different, lognormally distributed times (B). Once cells have initiated viral protein production, they produce protein at a constant rate, and their EGFP content increases in time to a saturation level (cells turning green in panel A). EGFP saturation level is directly proportional to the rate of production of EGFP. The life spans for protein-producing cells are lognormally distributed (C) irrespective of their protein production rates. The distribution of protein production rates is negatively correlated with the production starting time (D). For each starting time, protein production rate has a lognormal distribution (green bell-shaped curves on log scale in panel D), but the peak of this distribution corresponds to a lower production for later starting times. This means that the cells that start producing protein later have lower average EGFP saturation levels (cells turning lighter green when starting producing later in panel A).

