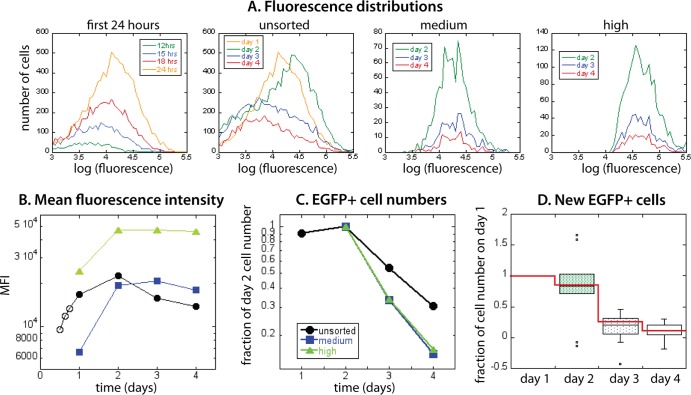
FIG 6.
Reproduction of the main experimental results by the model. (A) Fluorescence distributions have the same general appearance over time, with MFI of the unsorted distribution decreasing after day 2, and the sorted distributions stable after day 2. The EGFP+ cell numbers decline faster in the sorted (medium and high) cell populations than in the unsorted, with decline rate slowing down in time (C). The new EGFP+ cells appearing on each day (red line in panel D) closely follow the estimates from the experiment (box plot in the background of panel D).

