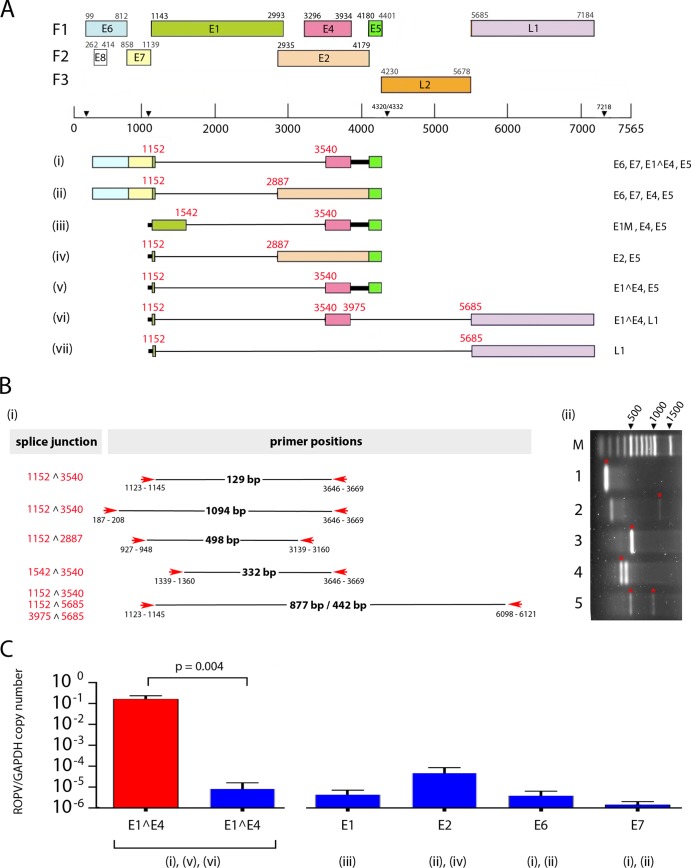
FIG 3.
(A) ROPV transcript map based on the analysis of cDNA prepared from a productive rabbit papilloma by a previously described methodology (26). The positions of splice donor and acceptor sites were determined experimentally and are shown in red. Individual transcripts along with their coding capacities are numbered i to vii at the bottom. The positions of the open reading frames and predicted promoter and polyadenylation sites have been reported previously (27) and are marked at the top. (B) Primers used for PCR amplification of ROPV cDNA fragments are indicated by red arrows, and the observed sizes of the amplified products are shown in black. For each primer pair, the amplified bands used for sequence analysis are shown in the gel image to the right and are marked with red asterisks. In addition to specific ROPV sequences, two additional bands were amplified in lanes 2 and 4 as a result of mispriming to cellular sequences. The specific splice junctions present in each PCR fragment are shown on the left. The sequences of the primers used have been reported previously (12). (C) The relative levels of transcripts containing the E1^E4 splice junction (species i, v, and vi) were examined in productive papillomas (red column) and at sites of latent infection (adjacent blue column). The E1^E4 primer pair gave rise to a 129-bp fragment, as shown in track 1 in panel Bii. An approximately 4-log-fold difference in levels was apparent. In latent infections, the relative level of transcripts spanning the E1 (species iii), E2 (species ii and iv), and E6 and E7 regions (species i and ii) are shown to the right of the graph (blue columns) along with the identified transcripts that span these regions.

