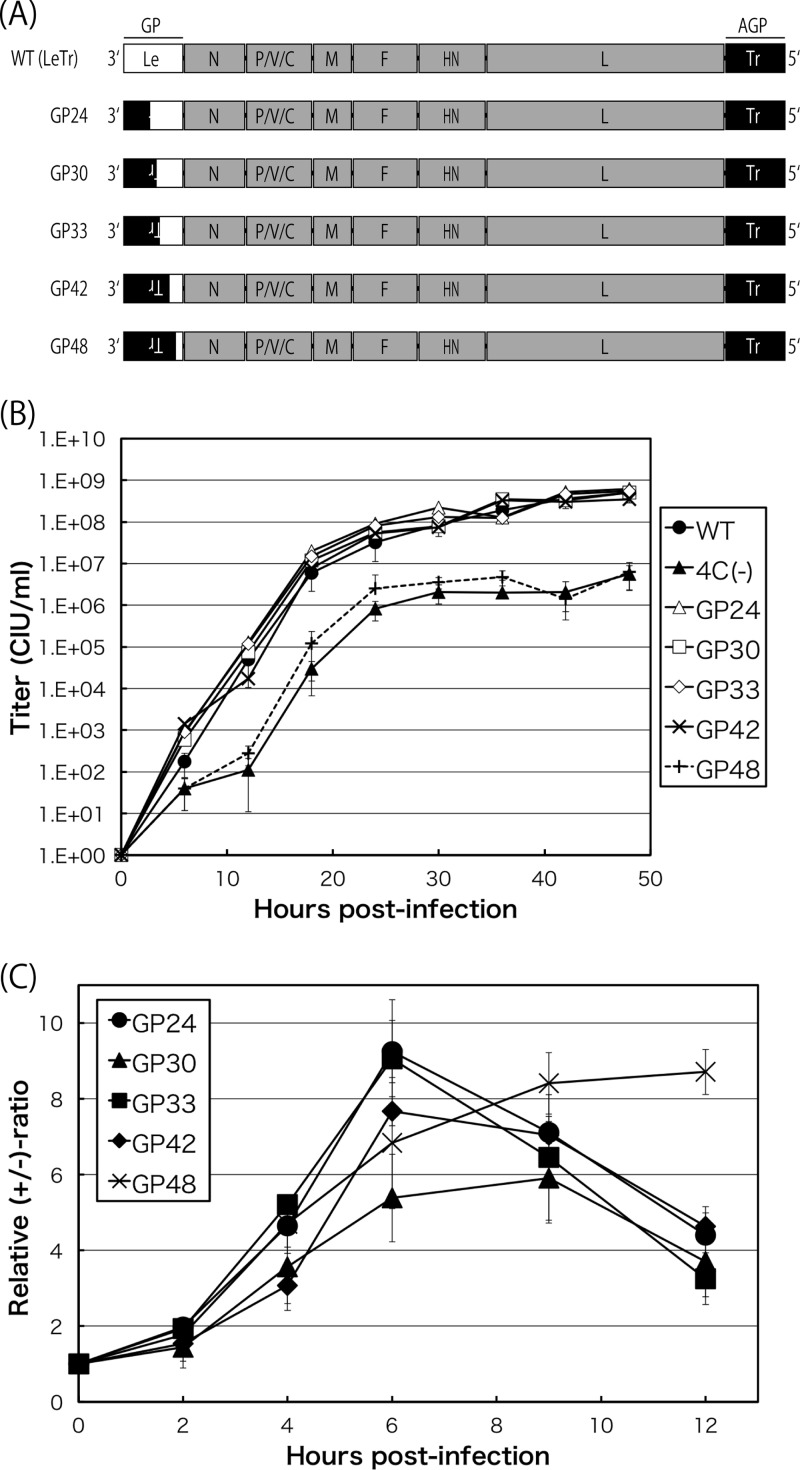
FIG 5.
(A) Schematic representation of the genome organization of the GP viruses, including GP24, GP30, GP33, GP42, and GP48. (B) One-step growth kinetics of the indicated SeVs, the WT, 4C(−), GP24, GP30, GP33, GP42, and GP48 viruses, in LLC-MK2 cells (closed circles, closed triangles, open triangles, open squares, open diamonds, exes, and pluses, respectively). Each titer represents the average from at least three independent experiments. (C) Kinetics of the relative +/− ratio in LLC-MK2 cells infected with the GP viruses, GP24, GP30, GP33, GP42, and GP48 (closed circles, closed triangles, closed squares, closed diamonds, and exes, respectively). Graphs represent the averages from at least three independent experiments.

