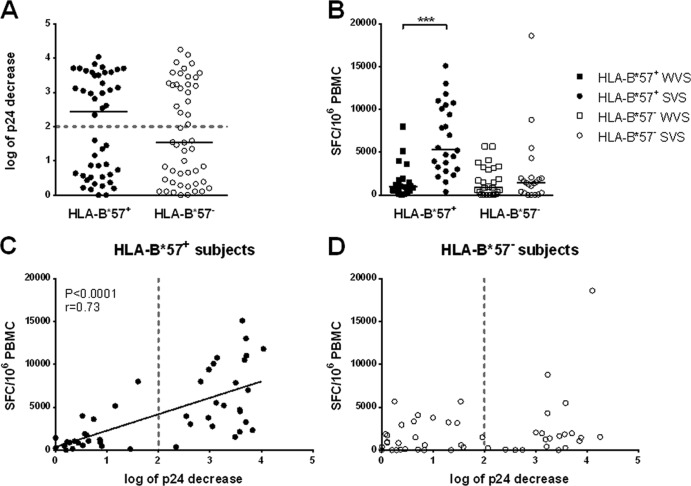
FIG 4.
Suppressive capacity was assessed in vitro in cocultures of infected or uninfected CD4+ and autologous CD8+ T cells and expressed as log of p24 decrease in culture supernatants. (A, C, and D) Suppressive capacity was measured in HLA-B*57+ (black circles) and HLA-B*57− subjects (clear circles) (A). The dotted line indicates the threshold of 2 log of p24 decrease that distinguishes weak viral suppressors (WVS) from strong viral suppressors (SVS). Suppressive capacity correlated with total HIV-specific response in HLA-B*57+ subjects (C), but there was no correlation in HLA-B*57− subjects (D). (B) The total HIV-specific response was measured by IFN-γ ELISpot assay in the four groups of subjects: HLA-B*57+ WVS (black squares), HLA-B*57+ SVS (black circles), HLA-B*57− WVS (clear squares), and HLA-B*57− SVS (clear circles).

