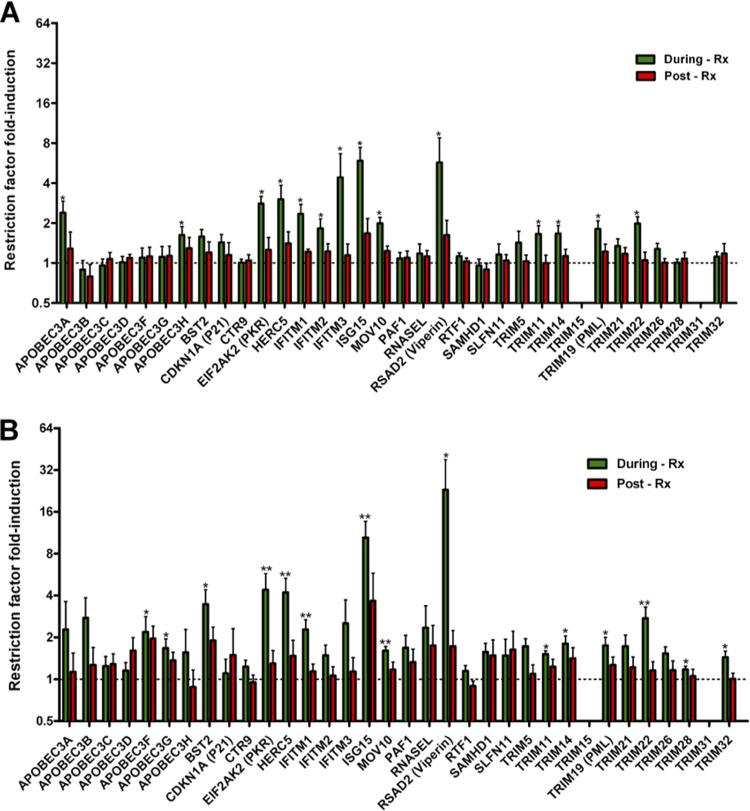
FIG 1.
IFN-α/riba induction of anti-HIV-1 restriction factors. (A) Fold induction in unfractionated PBMCs. (B) Fold induction in negatively selected CD4+ T cells. Values corresponding to fold induction during IFN-α/riba (green bars) and post-IFN-α/riba (red bars) treatment were normalized to the pretreatment expression level, as indicated by the dashed line. The mean and standard error are represented in each bar. Asterisks indicate statistically significant differences between the expression levels determined during and pretherapy based on a paired Wilcoxon test (* = P < 0.05; ** = P < 0.01).

