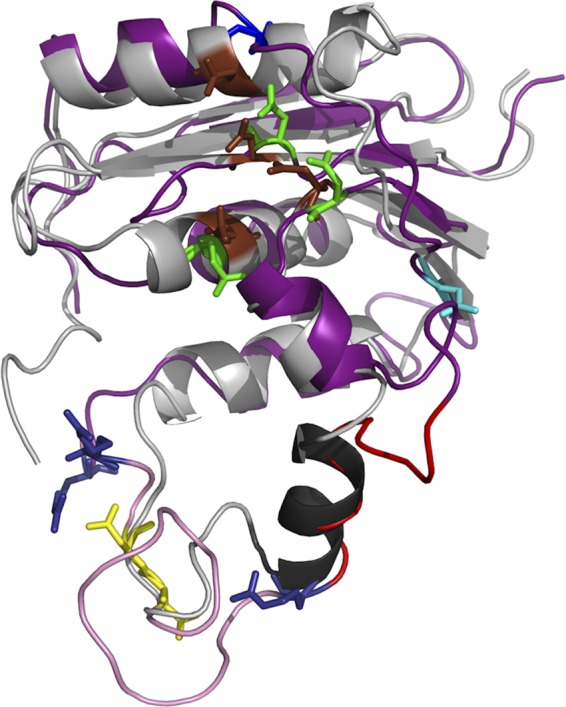
FIG 2.

Cartoon representation of the superimposition of the E. coli RNase H structure and the HBV RNase H model. The E. coli experimental structure is gray, with the C-helix in black and catalytic residues as brown sticks. The HBV RNase H model is deep purple. The first three catalytic residues and the four D residue candidates for the 4th catalytic residue are shown in sticks and colored as in Fig. 1, i.e., green (D689, E718, and D737), yellow (D777 and D778), cyan (D807), and blue (D817; top of the model). The putative basic protrusion is shown in pink, with the C-helix in red and arginine residues in deep blue (bottom of the model).
