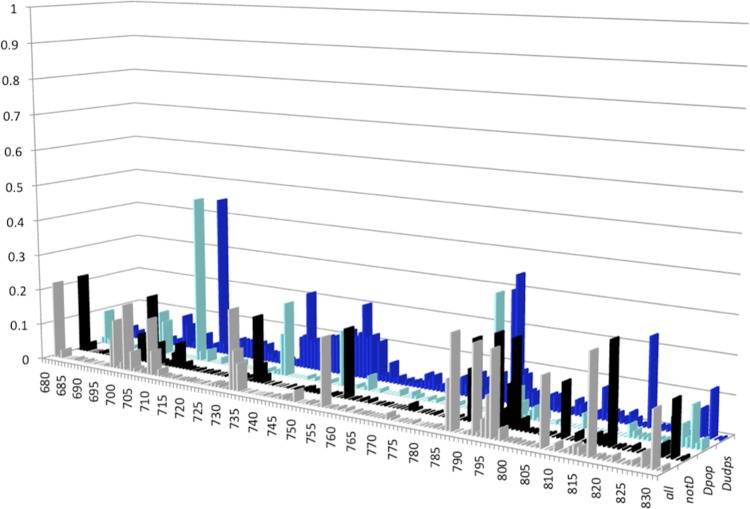
FIG 3.
Distribution of normalized Shannon entropy (NSE) values along the RNase H sequence in the four sequence data sets studied. The histograms for the three sequence data sets from the public database are gray (all data set; all sequences), black (notD data set; all sequences of genotypes other than D), and cyan (Dpop data set; sequences of genotype D only). The histogram for the data set of genotype D sequences generated by means of ultradeep sequencing (Dudps data set) is blue. The HBV RNase H sequence positions are numbered on the x axis. The y axis reports the NSE values. The four data sets are shown along the z axis.

