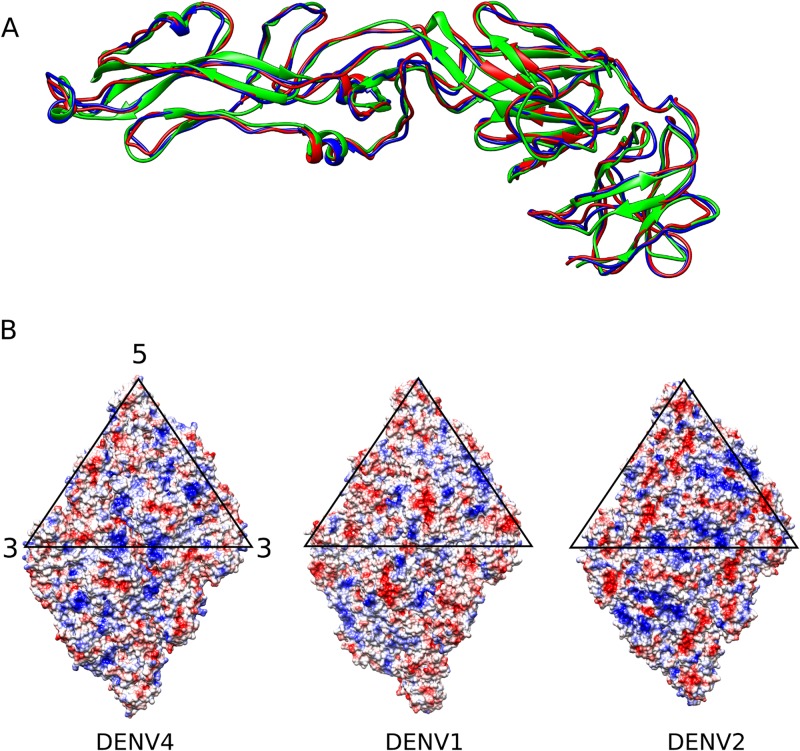
FIG 3.
Comparing DENV4 with DENV2 and DENV1. (A) Superposition of the E protein structures from the three serotypes: DENV1 (red), DENV2 (green), and DENV4 (blue). There is very little structural variation, with an RMSD of less than 2 Å. (B) Surface charge distribution on a raft for DENV4 (left), DENV1 (center), and DENV2 (right). Red indicates negative charge; blue indicates positive charge. Despite high protein sequence similarity (more than 60% identity between DENV4 and DENV1 or DENV2), the charge distributions are different.

